
Filed Pursuant to Rule 424(b)(4)
Registration No. 333-192232
PROSPECTUS
3,500,000 Shares
Common Stock
$5.75 per share
Amedica Corporation is offering 3,500,000 shares of its common stock. This is our initial public offering and no public market currently exists for our shares. The initial public offering price of our common stock is $5.75 per share.
Our common stock has been approved for listing on The NASDAQ Capital Market under the symbol “AMDA.”
We are an “emerging growth company” as defined under the Jumpstart Our Business Startups Act of 2012, and as such, have elected to comply with certain reduced public company reporting requirements for this prospectus and future filings.
We have granted the underwriters an option for a period of 30 days to purchase up to an additional 525,000 shares of common stock.
Investing in our common stock involves risks. See “Risk Factors” beginning on page 12.
| Per Share | Total | |||
| Public offering price |
$ 5.75 | $20,125,000 | ||
| Underwriting discount(1) |
$0.4025 | $ 1,408,750 | ||
| Proceeds, before expenses, to us |
$5.3475 | $18,716,250 |
| (1) | We refer you to “Underwriting” beginning on page 132 of this prospectus for additional information regarding total underwriting compensation. |
The underwriters expect to deliver the shares of common stock to purchasers on or about February 19, 2014.
Neither the Securities and Exchange Commission nor any state securities regulators has approved or disapproved of these securities or determined if this prospectus is truthful or complete. Any representation to the contrary is a criminal offense.
| JMP Securities | ||||
| Needham & Company | ||||
The date of this prospectus is February 12, 2014.

| Page | ||||
| 1 | ||||
| 12 | ||||
| 37 | ||||
| 39 | ||||
| 40 | ||||
| 41 | ||||
| 43 | ||||
| 44 | ||||
| 46 | ||||
| Management’s Discussion and Analysis of Financial Condition and Results of Operations |
48 | |||
| 68 | ||||
| 95 | ||||
| 100 | ||||
| 110 | ||||
| 118 | ||||
| 120 | ||||
| 125 | ||||
| Material U.S. Federal Tax Consequences for Non-U.S. Holders of Common Stock |
128 | |||
| 132 | ||||
| 138 | ||||
| 138 | ||||
| 138 | ||||
| F-1 | ||||
Through and including March 9, 2014 (25 days after the date of this prospectus), all dealers that effect transactions in these securities, whether or not participating in this offering, may be required to deliver a prospectus. This delivery is in addition to a dealer’s obligation to deliver a prospectus when acting as an underwriter and with respect to their unsold allotments or subscriptions.
You should rely only on the information contained in this prospectus. Neither we nor any of the underwriters has authorized anyone to provide you with information different from, or in addition to, that contained in this prospectus or any free writing prospectus prepared by or on behalf of us or to which we may have referred you in connection with this offering. We take no responsibility for, and can provide no assurance as to the reliability of, any other information that others may give you. Neither we nor any of the underwriters is making an offer to sell or seeking offers to buy these securities in any jurisdiction where or to any person to whom the offer or sale is not permitted. The information in this prospectus is accurate only as of the date on the front cover of this prospectus, regardless of the time of delivery of this prospectus or of any sale of shares of our common stock, and the information in any free writing prospectus that we may provide you in connection with this offering is accurate only as of the date of that free writing prospectus. Our business, financial condition, results of operations and future growth prospects may have changed since those dates.
This prospectus includes statistical and other industry and market data that we obtained from industry publications and research, surveys and studies conducted by third parties. Industry publications and third-party research, surveys and studies generally indicate that their information has been obtained from sources believed to be reliable, although they do not guarantee the accuracy or completeness of such information. While we believe these industry publications and third-party research, surveys and studies are reliable, we have not independently verified such data.
For investors outside the United States: neither we nor any of the underwriters have done anything that would permit this offering or possession or distribution of this prospectus or any free writing prospectus we may provide to you in connection with this offering in any jurisdiction where action for that purpose is required, other than in the United States. You are required to inform yourselves about and to observe any restrictions relating to this offering and the distribution of this prospectus and any free writing prospectus outside of the United States.
This summary highlights information contained elsewhere in this prospectus. Because it is only a summary, it does not contain all of the information that you should consider before investing in shares of our common stock and it is qualified in its entirety by, and should be read in conjunction with the more detailed information appearing elsewhere in this prospectus. You should read the entire prospectus carefully, especially “Risk Factors” and our consolidated financial statements and the related notes included in this prospectus. Unless the context requires otherwise, references to “Amedica,” “we,” “our” and “us” in this prospectus refer to Amedica Corporation and its subsidiary.
Amedica Corporation
Our Company
We are a commercial biomaterial company focused on using our silicon nitride technology platform to develop, manufacture and sell a broad range of medical devices. We currently market spinal fusion products and are developing products for use in total hip and knee joint replacements. We believe our silicon nitride technology platform enables us to offer new and transformative products in the orthopedic and other medical device markets. We believe we are the first and only company to use silicon nitride in medical applications and over 14,000 of our silicon nitride spine products have been implanted in patients.
Biomaterials are synthetic or natural materials available in a variety of forms that are used in virtually every medical specialty. We believe our silicon nitride biomaterial has superior characteristics compared to commonly used biomaterials in the markets we are targeting, including polyetheretherketone, or PEEK, which is the most common biomaterial used for interbody spinal fusion products. Specifically, we believe our silicon nitride has the following key attributes: promotion of bone growth; hardness, strength and resistance to fracture; resistance to wear; non-corrosive; anti-infective properties; and superior diagnostic imaging compatibility.
We currently market our Valeo family of silicon nitride interbody spinal fusion devices in the United States and Europe for use in the cervical and thoracolumbar areas of the spine. We believe our Valeo devices have a number of advantages over existing products due to silicon nitride’s key characteristics, resulting in faster and more effective fusion and reduced risk of infection. To date, the rate of adverse events reported to the U.S. Food and Drug Administration, or FDA, for our implanted Valeo interbody spinal fusion devices is 0.1%.
In addition to our silicon nitride-based spinal fusion products, we market a complementary line of non-silicon nitride spinal fusion products which allows us to provide surgeons and hospitals with a broader range of products. These products include three lines of spinal fusion devices and five types of orthobiologics, which are used by surgeons to help promote bone growth and fusion in spinal fusion procedures. Although our non-silicon nitride products have accounted for approximately 70% or more of our product revenues for the years ended December 31, 2012 and 2011 and the nine months ended September 30, 2013, we believe the continued promotion and potential for adoption of our silicon nitride products and product candidates, if approved, provides us the greatest opportunity to grow our business in new and existing markets and achieve our goal to become a leading biomaterial company.
We are also incorporating our silicon nitride technology into components for use in total hip and knee replacement product candidates that we are, or plan on, developing in collaboration with a strategic partner. We believe that our silicon nitride total hip and knee product candidates will provide competitive advantages over current products made with traditional biomaterials. We believe our silicon nitride technology platform can be used for developing products in other markets and have developed prototypes for use in the dental, sports medicine and trauma markets. As a result of some of the key characteristics of our silicon nitride, we also believe our coating technology may be used to enhance our metal products as well as commercially available metal spinal fusion, joint replacement and other medical products.
We operate a 30,000 square foot manufacturing facility located at our corporate headquarters in Salt Lake City, Utah, and we are the only vertically integrated silicon nitride orthopedic medical device manufacturer in the
1
world. We market and sell our products to surgeons and hospitals in the United States and select markets in Europe and South America through our established network of more than 50 independent sales distributors who are managed by our experienced in-house sales and marketing management team.
Market Opportunity
Our products and product candidates target the interbody spinal fusion and total hip and knee joint replacement markets. According to iData Research, Inc., in 2012, the markets for spinal implants in the United States and in combined major European markets were $5.3 billion and $1.0 billion, respectively. Interbody spinal fusions accounted for over $1.2 billion and $172.2 million of these markets, respectively. Additionally, Orthopedic Network News reported that the U.S. markets for the components of total hip and knee replacement product candidates that we are initially developing were $455.0 million and $1.5 billion, respectively.
Our Silicon Nitride Technology Platform
We believe our silicon nitride, an advanced ceramic, is ideally suited for use in many medical applications and has the following characteristics that make it superior to other biomaterials, which do not possess all of these characteristics:
| • | Promotes Bone Growth. The biomaterials used in interbody spinal fusion devices should promote bone growth in and around the device to further support fusion and stability. Our silicon nitride has an inherent surface chemistry and topography which creates an ideal environment for the promotion of new bone growth. |
| • | Hard, Strong and Resistant to Fracture. The biomaterials used in interbody spinal fusion devices and joint replacement implants should be strong and resistant to fracture during implantation of the device and withstand the static and dynamic forces exerted on the spine or to adequately bear the significant loads placed on joints during daily activities. Biomaterials used in joint replacements should also be resistant to deformation, which is referred to as hardness. We believe our silicon nitride is hard, strong and resistant to fracture. |
| • | Anti-Infective. Infection is a serious problem in orthopedic surgery and treating device-related infection generally requires extensive repeat surgery, including replacement, or revision, surgery, which extends patient suffering and increases costs. We have demonstrated in in vitro and in vivo studies that our silicon nitride has inherent anti-infective properties, which reduce the risk of infection in and around a silicon nitride device. We demonstrated that live bacteria counts were between 8 to 30 times lower on silicon nitride than PEEK and up to 8 times lower on silicon nitride than titanium, another commonly used biomaterial. |
| • | Imaging Compatible. The biomaterials used in interbody spinal fusion devices should be visible through, and not inhibit the effective use of, common surgical and diagnostic imaging techniques, such as x-ray, CT and MRI. Our silicon nitride interbody spinal fusion devices are semi-radiolucent and clearly visible in x-rays, and produce no distortion under MRI and no scattering under CT. These characteristics enable an exact view of the device for precise intra-operative placement and post-operative bone fusion assessment in spinal fusion procedures. We believe these qualities provide surgeons with greater certainty of outcomes with our silicon nitride devices than with other biomaterials, such as PEEK and metals. |
| • | Resistant to Wear. The biomaterials used in joint replacement procedures should have sufficient hardness and toughness, as well as extremely smooth surfaces, to effectively resist wear. Because the articulating implants move against each other, they are subject to friction and cyclic loading, which frequently lead to abrasive wear and fatigue failure. We believe joint implants incorporating our silicon nitride components will have comparable or higher resistance to wear than the two most commonly used combinations of biomaterials in total hip replacement implants. |
| • | Non-Corrosive. Biomaterials should be non-corrosive and should not cause adverse patient reactions. Metal placed in the human body corrodes over time and also results in the release of metal ions that can cause serious adverse reactions and conditions. Our silicon nitride does not have the drawbacks associated with the corrosive nature of metal within the body nor does it result in the release of metal ions into the body. |
2
We produce silicon nitride in four forms: (1) a fully dense, load-bearing solid, referred to as MC2; (2) a porous bone-like cancellous structured form, referred to as CSC; (3) a composite incorporating both our solid MC2 material and our porous CSC material intended to promote an ideal environment for bone growth; and (4) a coating for application onto other biomaterials. This capability provides us with the ability to utilize our silicon nitride in distinct ways depending on its intended application, which, together with our silicon nitride’s key characteristics, distinguishes us from manufacturers of other biomaterials and our products from products using other biomaterials.
Our Competitive Strengths
We believe we can use our silicon nitride technology platform to become a leading biomaterial company and have the following principal strengths:
| • | Sole Provider of Silicon Nitride Medical Devices. We believe we are the only company that designs, develops, manufactures and sells medical grade silicon nitride-based products. |
| • | In-House Manufacturing Capabilities. We operate a 30,000 square foot manufacturing facility located at our corporate headquarters in Salt Lake City, Utah. This state-of-the-art facility allows us to rapidly design and produce silicon nitride products and control the entire manufacturing process from raw material to finished goods. We are also party to a cooperative research and development agreement with Kyocera Industrial Ceramics Corporation, or Kyocera, under which we will work with Kyocera to determine its ability to become a second qualified manufacturer of our silicon nitride-based spinal fusion products and product candidates. |
| • | Established Commercial Infrastructure. We market and sell our products to surgeons and hospitals in the United States and select markets in Europe and South America through our established network of more than 50 independent sales distributors who are managed by our experienced in-house sales and marketing management team. |
| • | Portfolio of Non-Silicon Nitride Products. We offer a full suite of spinal fusion products, which increases our access to surgeons and hospitals and allows us to more effectively market our silicon nitride spinal fusion products to our customers. |
| • | Highly Experienced Management and Surgeon Advisory Team. We have recently assembled a senior management team with over 150 years of collective experience in the healthcare industry. Members of our management team have experience in product development, launching of new products into the orthopedics market and selling to hospitals through direct sales organizations, distributors, manufacturers and other orthopedic companies. We also collaborate with a network of leading surgeon advisors in the design, development and use of our products and product candidates. |
Our Strategy
Our goal is to become a leading biomaterial company focused on using our silicon nitride technology platform to develop, manufacture and commercialize a broad range of medical devices. Key elements of our strategy to achieve this goal are the following:
| • | Drive Further Adoption of our Silicon Nitride Interbody Spinal Fusion Devices. We believe that increasing the awareness of our silicon nitride technology by educating surgeons about its key benefits, and the design improvements to our silicon nitride products and related instruments, will accelerate the adoption of our products and ultimately help improve patient outcomes. To drive further awareness of our products and the associated benefits offered by our silicon nitride technology, we will continue to educate surgeons through multiple channels, including industry conferences and meetings, media outlets and through our sales and marketing efforts. |
| • | Continue to Implement our Design and Build Program. In the first half of 2013, we initiated a commercialization strategy, referred to as our Design and Build Program, in which we collaborate with |
3
| influential surgeons to develop customized silicon nitride spinal fusion products and instruments. We first sell these products to the designing surgeons and a team of evaluating surgeons. After evaluation and acceptance by these surgeons, we plan to introduce these products more broadly into the market. The first products designed under this program were sold for initial evaluation in the third quarter of 2013. |
| • | Enhance our Commercial Infrastructure. We expect to increase the productivity of our sales and marketing team by continuing to engage experienced independent sales distributors with strong orthopedic surgeon relationships. For example, in October 2013, we entered into a new European sales agent agreement with K2M, Inc., one of the largest privately held spinal device companies in the world. We may also establish distribution collaborations in the United States and abroad when access to large or well-established sales and marketing organizations may help us gain access to new markets, increase sales in our existing markets or accelerate market penetration for selected products. |
| • | Develop Silicon Nitride for Total Joint Components. We are incorporating our silicon nitride technology into silicon nitride-coated metal components for use in total hip and knee replacement product candidates that we plan on developing in collaboration with a strategic partner. We also have designs for solid silicon nitride components and we will make a decision in the future about whether to pursue the development of these components. In December 2013, we participated in a pre-submission meeting with the FDA to finalize the regulatory requirements for a 510(k) clearance of our silicon nitride-coated total joint components in the United States. The FDA reviewers confirmed that the regulatory pathway would be a standard 510(k) clearance with supporting biomechanical testing. In response, we intend to develop silicon nitride-coated metal joint replacement components and then, together with a strategic partner, initiate biomechanical testing with our silicon nitride-coated metal components for use in total hip and knee replacement procedures to support a 510(k) submission to the FDA. We intend to pursue clearance of a total hip replacement product first and, if clearance is obtained, we intend to commercially launch silicon nitride-coated metal products for use in total hip replacement by the second half of 2015. |
| • | Apply our Silicon Nitride Technology Platform to Other Opportunities. Our silicon nitride technology platform is adaptable and we believe it may be used to develop products to address other significant opportunities, such as in the dental, sports medicine and trauma markets. We have manufactured prototypes of dental implants, sports medicine and trauma products, and we have developed a process to coat metals with our silicon nitride to enhance current medical devices and instruments. We plan to collaborate with other companies to develop and commercialize any future products in those areas or we may develop any one of them by ourselves should sufficient resources become available. |
Risks Associated with Our Business
Our business is subject to a number of risks that you should be aware of before making an investment decision. These risks are discussed more fully in the section of this prospectus entitled “Risk Factors” immediately following this prospectus summary. You should read these risks before you invest in our common stock. We may be unable, for many reasons, including those that are beyond our control, to implement our business strategy. In particular, risks associated with our business include:
| • | our accumulated deficit as of September 30, 2013, of $140.6 million, and we expect we will continue to incur additional, and possibly increasing, losses, which, among other things, raises doubts about our ability to continue as a going concern; |
| • | our success depends on our ability to successfully commercialize silicon nitride-based medical devices, which to date have experienced only limited market acceptance and may not be widely accepted by hospitals and surgeons in the future; |
| • | we may not be able to increase the productivity of our sales and marketing infrastructure to successfully penetrate the spinal fusion market; |
| • | our long-term success depends substantially on our ability to obtain regulatory clearance or approval of our product candidates and then successfully commercializing these product candidates; |
4
| • | the orthopedic market is highly competitive and we may not be able to compete effectively against the larger, well-established companies that dominate this market or emerging and small innovative companies; and |
| • | we and our independent registered public accounting firm have identified material weaknesses and a significant deficiency in our internal control over financial reporting, which increases the risk of material misstatements in our future financial statements. |
Preliminary Unaudited Fourth Quarter and 2013 Financial Expectations
Set forth below are certain preliminary revenue, cost, expense and net loss expectations for the three months and the year ended December 31, 2013. As we complete our year-end financial close process and finalize our 2013 financial statements, we will be required to make significant judgments in a number of areas, including inventory, stock-based compensation, income taxes, long-lived and intangible assets, and the liability for preferred stock warrants and common stock warrants. As described elsewhere in this prospectus, we have identified four material weaknesses in our internal control over financial reporting involving our financial close process. It is possible that we or our auditors may identify items that require us to make adjustments to the financial information set forth below and those changes could be material. Additionally, the risk of a material adjustment could be greater as a result of the material weaknesses described above. Our independent registered public accounting firm has not audited, reviewed, or performed any procedures with respect to this preliminary financial data and accounting treatment information and does not express an opinion or any other form of assurance with respect thereto. We expect to complete our financial statements for the year ended December 31, 2013 subsequent to the completion of this offering. Accordingly, undue reliance should not be placed on these preliminary estimates. These preliminary estimates are not necessarily indicative of any future period and should be read together with “Risk Factors,” “Special Note Regarding Forward-looking Statements,” “Management’s Discussion and Analysis of Financial Condition and Results of Operations,” “Selected Consolidated Financial Data” and our financial statements and related notes included elsewhere in this prospectus.
We estimate that our total product revenue for the three months ended December 31, 2013 will be between approximately $5.2 million and $5.7 million, of which 41% is estimated to consist of silicon nitride product sales, as compared to $5.9 million for the three months ended December 31, 2012, of which 32% consisted of silicon nitride product sales. This estimated decrease in total product revenue was primarily attributable to the timing of the launch of our second generation Valeo products. The estimated increase in the proportion of silicon nitride product sales for the three months ended December 31, 2013 was primarily attributable to the focus of a new sales team on silicon nitride product sales versus non-silicon nitride product sales.
We estimate that our total product revenue for the year ended December 31, 2013 will be between approximately $21.8 million and $22.3 million, of which 34% is estimated to consist of silicon nitride product sales, as compared to $23.1 million for the year ended December 31, 2012, of which 29% consisted of silicon nitride product sales. This estimated decrease in total product revenue was primarily attributable to the restructuring of our sales and marketing teams during the first quarter of 2013, resulting from changes in our distribution network, the timing of the launch of our second generation Valeo products and a one-time sale of non-silicon nitride products to a customer in 2012 with no corresponding sale in 2013. The estimated increase in the proportion of silicon nitride product sales for the year ended December 31, 2013 was primarily attributable to the one-time sale of non-silicon nitride products in 2012 and the focus of the new sales team on silicon nitride product sales versus non-silicon nitride product sales.
We believe that our cost of revenue and operating expenses, other than impairment expense, for the three months and year ended December 31, 2013 will be generally consistent with cost of revenue and operating expenses in the same periods in the prior year. We cannot accurately estimate at this time impairment expense, if any, for the year ended December 31, 2013. When we complete our impairment review and if we determine our intangible assets are impaired, the maximum impairment expense we could record for the year ended December 31, 2013 would not exceed the $15.3 million impairment expense we recorded for the year ended December 31, 2012.
5
We expect interest expense, the most significant component of our other expenses, for the three months and year ended December 31, 2013 will be less than the $1.7 million and $5.6 million of interest expense for the three months and year ended December 31, 2012, respectively. This expected decrease is due to the lower interest on our senior secured credit facility we had in place in 2013 as compared to the interest we incurred in 2012 related to our senior secured convertible promissory notes and certain assumed acquisition indebtedness that was outstanding until December 2012. However, we have not completed an analysis of the other components of our other expenses, including expenses for a change in fair value of preferred stock warrants and common stock warrants, and, as a result we cannot estimate other components of our other expenses with certainty at this time. Accordingly, we expect to incur net losses for the three months and the year ended December 31, 2013; however, no conclusions should be drawn as to the size of our net loss based on the foregoing revenue and expense estimates.
Implications of Being an Emerging Growth Company
As a company with less than $1.0 billion in revenue during our most recently completed fiscal year, we qualify as an “emerging growth company” as defined in Section 2(a) of the Securities Act of 1933 or the Securities Act, as modified by the Jumpstart Our Business Startups Act of 2012, or the JOBS Act. As an emerging growth company, we may take advantage of specified reduced disclosure and other requirements that are otherwise applicable, in general, to public companies that are not emerging growth companies. These provisions include:
| • | reduced disclosure about our executive compensation arrangements; |
| • | no requirement to hold non-binding stockholder advisory votes on executive compensation or golden parachute arrangements; |
| • | exemption from the auditor attestation requirement in the assessment of our internal control over financial reporting; and |
| • | reduced disclosure of financial information in this prospectus, including two years of audited financial information and two years of selected financial information. |
We may take advantage of these exemptions for up to five years or such earlier time that we are no longer an emerging growth company. Accordingly, the information contained herein may be different than the information you receive from other public companies in which you hold stock. We would cease to be an emerging growth company if we have more than $1.0 billion in annual revenues as of the end of a fiscal year, if we are deemed to be a large-accelerated filer under the rules of the Securities and Exchange Commission, or if we issue more than $1.0 billion of non-convertible debt over a three-year-period.
The JOBS Act also permits us, as an emerging growth company, to take advantage of an extended transition period to comply with new or revised accounting standards applicable to public companies and thereby allows us to delay the adoption of those standards until those standards would apply to private companies. We are electing to use this extended transition period under the JOBS Act. As a result, our financial statements may not be comparable to the financial statements of issuers who are required to comply with the effective dates for new or revised accounting standards that are applicable to public companies.
Corporate Information
We were incorporated in Delaware in 1996 under the name Amedica Corp. and have since changed our name to Amedica Corporation. Effective September 20, 2010, we acquired all of the outstanding shares of US Spine, Inc. which then became our wholly-owned subsidiary, which is our only subsidiary. Our principal executive offices are located at 1885 West 2100 South, Salt Lake City, Utah 84119, and our telephone number is (801) 839-3500. Our web site address is www.amedicacorp.com. The information on, or that may be accessed through, our web site is not incorporated by reference into this prospectus and should not be considered a part of this prospectus.
Certain monetary amounts, percentages and other figures included in this prospectus have been subject to rounding adjustments. Accordingly, figures shown as totals in certain tables may not be the arithmetic aggregation of the figures that precede them, and figures expressed as percentages in the text may not total 100% or, as applicable, when aggregated may not be the arithmetic aggregation of the percentages that precede them.
6
“Amedica,” “CSC,” “MC2,” “Valeo” and “rethink what’s possible” are registered U.S. trademarks of Amedica Corporation. “US Spine” is a registered U.S. trademark of our subsidiary, US Spine, Inc. All other trademarks, trade names and service marks appearing in this prospectus are the property of their respective owners. Trademarks and trade names referred to in this prospectus, including logos, artwork and other visual displays, may appear without the ® or TM symbols for convenience. Such references are not intended to indicate, in any way, that we will not assert, to the fullest extent under applicable law, our rights or the rights of the applicable licensor to these trademarks and trade names. We do not intend our use or display of other companies’ trade names or trademarks to imply a relationship with, or endorsement or sponsorship of us by, any other companies.
7
THE OFFERING
| Common stock offered by us |
3,500,000 shares (or 4,025,000 shares if the underwriters exercise in full their option to purchase additional shares) |
| Common stock to be outstanding after this offering |
12,127,454 shares (or 12,652,454 shares if the underwriters exercise in full their option to purchase additional shares) |
| Option to purchase additional shares |
We have granted to the underwriters the option, exercisable for 30 days from the date of this prospectus, to purchase up to 525,000 additional shares of common stock. |
| Use of proceeds |
We intend to use the net proceeds from this offering (i) to primarily support debt service under our existing senior secured credit facility with General Electric Capital Corporation, or GE Capital, as agent and lender, and Zions First National Bank, as lender, which we refer to as the GE Secured Lending Facility, as well as to support working capital needs and other general corporate purposes, (ii) to fund research and development and commercialization activities of our product candidates, including the funding of clinical trials we plan to conduct for our product candidates, and (iii) to continue to build sales, marketing and distribution capabilities for our silicon nitride technology platform, including the costs of inventory and instruments. See “Use of Proceeds.” |
| Offering price |
$5.75 per share |
| Risk factors |
See “Risk Factors” beginning on page 12 and other information included in this prospectus for a discussion of factors that you should consider carefully before deciding to invest in our common stock. |
| NASDAQ Capital Market symbol |
AMDA |
The number of shares of our common stock to be outstanding after this offering is based on 597,675 shares of common stock outstanding as of September 30, 2013, and assumes the conversion of all of our shares of convertible preferred stock outstanding as of September 30, 2013 into 8,029,779 shares of common stock upon the completion of this offering. It does not include:
| • | 93,220 shares of common stock issuable upon the exercise of outstanding options to purchase common stock as of September 30, 2013 under our 2003 Stock Option Plan, or the 2003 Plan, at a weighted-average exercise price of $29.38 per share; |
| • | 159,834 shares of common stock issuable upon the exercise of warrants for shares of Series C, Series D, Series E and Series F convertible preferred stock, on an as converted basis, outstanding as of September 30, 2013, at a weighted-average exercise price of $59.28 per share; |
| • | 473,835 shares of common stock issuable upon the exercise of warrants for shares of our common stock outstanding as of September 30, 2013, at a weighted-average exercise price of $28.09 per share; |
8
| • | 188,128 shares of common stock issuable upon the vesting of outstanding restricted stock units, or RSUs, issued under our Amended and Restated 2012 Equity Incentive Plan, or the 2012 Plan, outstanding as of January 15, 2014; |
| • | 13,189 shares of common stock issuable upon the exercise of existing options to purchase common stock as of January 15, 2014 under the 2012 Plan at an exercise price of $17.53 per share; |
| • | 1,405,902 shares of our common stock issuable upon the vesting of RSUs to be issued under our 2012 Plan in connection with this offering; and |
| • | 1,392,781 additional shares of common stock reserved for issuance under the 2012 Plan, which reflects a November 2013 amendment and January 2014 amendments to the 2012 Plan, subject to the completion of this offering. |
Unless otherwise indicated, all information contained in this prospectus:
| • | assumes the underwriters do not exercise their option to purchase up to an additional 525,000 shares of our common stock; |
| • | reflects a 1-for-25.7746 reverse split of our common stock effected on February 11, 2014; |
| • | reflects the automatic conversion of all of our outstanding shares of convertible preferred stock into 8,029,779 shares of common stock upon completion of this offering, based on the initial public offering price of $5.75 per share; |
| • | reflects the conversion of all outstanding warrants exercisable for 2,344,731 shares of preferred stock into warrants exercisable for 159,834 shares of common stock upon completion of this offering; and |
| • | assumes the adoption of our restated certificate of incorporation and restated bylaws upon the completion of this offering. |
9
SUMMARY CONSOLIDATED FINANCIAL DATA
The summary consolidated financial data set forth below should be read in conjunction with our consolidated financial statements and the related notes, “Selected Consolidated Financial Data” and “Management’s Discussion and Analysis of Financial Condition and Results of Operations” included elsewhere in this prospectus.
We derived the summary consolidated statement of comprehensive loss data for the fiscal years ended December 31, 2011 and 2012 from our audited consolidated financial statements appearing elsewhere in this prospectus. We derived the summary consolidated statement of comprehensive loss data for the nine months ended September 30, 2012 and 2013 and consolidated balance sheet data as of September 30, 2013 from our unaudited consolidated financial statements appearing elsewhere in this prospectus.
| Years Ended December 31, |
Nine Months Ended September 30, |
|||||||||||||||
| 2011 | 2012 | 2012 | 2013 | |||||||||||||
| (unaudited) | ||||||||||||||||
| (in thousands, except per share amounts) | ||||||||||||||||
| Consolidated Statement of Comprehensive Loss Data: |
||||||||||||||||
| Product revenue |
$ | 20,261 | $ | 23,065 | $ | 17,126 | $ | 16,604 | ||||||||
| Cost of revenue |
||||||||||||||||
| Product revenue |
4,088 | 5,423 | 3,363 | 4,235 | ||||||||||||
| Write-down of excess and obsolete inventory |
— | 1,043 | — | 778 | ||||||||||||
|
|
|
|
|
|
|
|
|
|||||||||
| Total cost of revenue |
4,088 | 6,466 | 3,363 | 5,013 | ||||||||||||
|
|
|
|
|
|
|
|
|
|||||||||
| Gross profit |
16,173 | 16,599 | 13,763 | 11,591 | ||||||||||||
|
|
|
|
|
|
|
|
|
|||||||||
| Operating expenses |
||||||||||||||||
| Research and development |
7,789 | 6,013 | 4,488 | 2,866 | ||||||||||||
| General and administrative |
7,263 | 7,313 | 5,458 | 4,067 | ||||||||||||
| Sales and marketing |
17,145 | 17,094 | 11,944 | 12,123 | ||||||||||||
| Impairment loss on intangible assets |
— | 15,281 | — | — | ||||||||||||
| Change in fair value of contingent consideration |
4,832 | — | — | — | ||||||||||||
|
|
|
|
|
|
|
|
|
|||||||||
| Total operating expenses |
37,029 | 45,701 | 21,890 | 19,056 | ||||||||||||
|
|
|
|
|
|
|
|
|
|||||||||
| Loss from operations |
(20,856 | ) | (29,102 | ) | (8,127 | ) | (7,465 | ) | ||||||||
| Other income (expense) |
||||||||||||||||
| Interest income |
72 | 57 | 45 | 13 | ||||||||||||
| Interest expense |
(3,456 | ) | (5,611 | ) | (3,864 | ) | (1,345 | ) | ||||||||
| Loss on extinguishment of debt |
— | (251 | ) | — | — | |||||||||||
| Change in fair value of preferred stock warrants |
308 | (85 | ) | (110 | ) | 73 | ||||||||||
| Change in fair value of common stock warrants |
172 | (618 | ) | 1,348 | (224 | ) | ||||||||||
| Other income / (expense) |
9 | (151 | ) | (4 | ) | — | ||||||||||
|
|
|
|
|
|
|
|
|
|||||||||
| Total other expense |
(2,895 | ) | (6,659 | ) | (2,585 | ) | (1,483 | ) | ||||||||
|
|
|
|
|
|
|
|
|
|||||||||
| Other expense, net |
||||||||||||||||
| Net loss before income taxes |
(23,751 | ) | (35,761 | ) | (10,712 | ) | (8,948 | ) | ||||||||
| Income tax benefit |
— | 726 | — | — | ||||||||||||
|
|
|
|
|
|
|
|
|
|||||||||
| Net loss |
$ | (23,751 | ) | $ | (35,035 | ) | $ | (10,712 | ) | (8,948 | ) | |||||
|
|
|
|
|
|
|
|
|
|||||||||
| Other comprehensive loss, net of tax: |
||||||||||||||||
| Unrealized gain / (loss) on marketable securities |
(23 | ) | 25 | 35 | (2 | ) | ||||||||||
| Total comprehensive loss |
$ | (23,774 | ) | $ | (35,010 | ) | $ | (10,677 | ) | $ | (8,950 | ) | ||||
|
|
|
|
|
|
|
|
|
|||||||||
| Net loss per share attributable to common stockholders |
||||||||||||||||
| Basic and diluted(1) |
$ | (68.28 | ) | $ | (100.52 | ) | $ | (30.74 | ) | $ | (17.64 | ) | ||||
|
|
|
|
|
|
|
|
|
|||||||||
| Shares used to calculate net loss attributable to common stockholders |
||||||||||||||||
| Basic and diluted(1) |
348 | 349 | 348 | 507 | ||||||||||||
| Pro forma net loss per share attributable to common stockholders (unaudited) |
||||||||||||||||
| Basic and diluted(1) |
$ | (9.86 | ) | $ | (1.21 | ) | ||||||||||
|
|
|
|
|
|||||||||||||
| Weighted-average shares used to calculate pro forma net loss per share attributable to common stockholders (unaudited) |
||||||||||||||||
| Basic and diluted(1) |
3,544 | 7,469 | ||||||||||||||
|
|
|
|
|
|||||||||||||
| (1) | See Note 1 to our consolidated financial statements included elsewhere in this prospectus for an explanation of the method used to calculate the historical and pro forma net loss per share, basic and diluted, and the number of shares used in the computation of the per share amounts. |
10
| As of September 30, 2013 | ||||||||||||
| (unaudited) | ||||||||||||
| (in thousands) | ||||||||||||
| Actual | Pro Forma(1) | Pro
Forma as Adjusted (1)(2) |
||||||||||
| Consolidated Balance Sheet Data: |
||||||||||||
| Cash, restricted cash and cash equivalents(3) |
$ | 7,861 | $ | 7,861 | $ | 22,332 | ||||||
| Working capital |
(1,708 | ) | (1,708 | ) | 12,764 | |||||||
| Total assets |
35,569 | 35,569 | 50,040 | |||||||||
| Long-term debt, including current portion |
17,917 | 17,917 | 17,917 | |||||||||
| Convertible preferred stock |
161,456 | — | — | |||||||||
| Total stockholders’ equity (deficit) |
(153,896 | ) | 8,012 | 22,483 | ||||||||
| (1) | The pro forma balance sheet data above reflect our unaudited capitalization as of September 30, 2013, on a pro forma basis giving effect to (i) the automatic conversion of all outstanding shares of convertible preferred stock into an aggregate of 8,029,779 shares of our common stock upon the completion of this offering, and (ii) the conversion of all outstanding warrants to purchase shares of our convertible preferred stock into warrants to purchase an aggregate of 159,834 shares of our common stock (but not assuming the exercise of the common stock warrants) and the related reclassification of the preferred stock warrant liability to additional paid-in-capital upon the completion of this offering. |
| (2) | The pro forma as adjusted balance sheet data above reflects the issuance of 3,500,000 shares of our common stock upon the completion of this offering at the initial public offering price of $5.75 per share, after deducting underwriting discounts and commissions and estimated offering expenses payable by us, as if this offering occurred on September 30, 2013. |
| (3) | Restricted cash consists of cash we receive from payments of our accounts receivables held in a segregated account that must be applied to pay amounts owed under our revolving credit facility. |
11
An investment in shares of our common stock involves a high degree of risk. You should carefully read and consider the risks described below, as well as the other information in this prospectus, including our financial statements and the related notes, before deciding to invest in our common stock. The occurrence of any of the following risks could have a material adverse effect on our business, financial condition, results of operations or cash flows. In that case, the trading price of our common stock could decline, and you could lose all or part of your investment.
Risks Related to Our Business and Strategy
We have incurred net losses since our inception and anticipate that we will continue to incur substantial net losses for the foreseeable future. We may never achieve or sustain profitability.
We have incurred substantial net losses since our inception. For the years ended December 31, 2011 and 2012 and the nine months ended September 30, 2012 and 2013, we incurred a net loss of $23.8 million, $35.0 million, $10.7 million and $8.9 million, respectively, and used cash in operations of $14.9 million, $9.7 million, $6.4 million and $5.5 million, respectively. We have an accumulated deficit of $131.6 million as of December 31, 2012 and $140.6 million as of September 30, 2013. With the exception of a small net income for the years ended December 31, 2002 and 1999, we have incurred net losses in each year since inception. Our losses have resulted principally from costs incurred in connection with our sales and marketing activities, research and development activities, manufacturing activities, general and administrative expenses associated with our operations, impairments on intangible assets and interest expense. Even if we are successful in launching additional products into the market, we expect to continue to incur substantial losses for the foreseeable future as we continue to sell and market our current products and research and develop, and seek regulatory approvals for, our product candidates.
If sales revenue from any of our current products or product candidates that receive marketing clearance from the FDA or other regulatory body is insufficient, if we are unable to develop and commercialize any of our product candidates, or if our product development is delayed, we may never become profitable. Even if we do become profitable, we may be unable to sustain or increase our profitability on a quarterly or annual basis.
Our success depends on our ability to successfully commercialize silicon nitride-based medical devices, which to date have experienced only limited market acceptance.
We believe we are the first and only company to use silicon nitride in medical applications. To date, however, we have had limited acceptance of our silicon nitride-based products and our product revenue has been derived substantially from our non-silicon nitride products. In order to succeed in our goal of becoming a leading biomaterial technology company utilizing silicon nitride, we must increase market awareness of our silicon nitride interbody spinal fusion products, continue to implement our sales and marketing strategy, enhance our commercial infrastructure and commercialize our silicon nitride joint replacement components and other products. If we fail in any of these endeavors or experience delays in pursuing them, we will not generate revenues as planned and will need to curtail operations or seek additional financing earlier than otherwise anticipated.
Our current products and our future products may not be accepted by hospitals and surgeons and may not become commercially successful.
Although we received 510(k) regulatory clearance from the FDA for our first silicon nitride spinal fusion products in 2008, we have not been able to obtain significant market share of the interbody spinal fusion market to date, and may not obtain such market share in the future. Even if we receive regulatory clearances or approvals for our product candidates in development, these product candidates may not gain market acceptance among orthopedic surgeons and the medical community. Orthopedic surgeons may elect not to use our products for a variety of reasons, including:
| • | lack or perceived lack of evidence supporting the beneficial characteristics of our silicon nitride technology; |
| • | limited long-term data on the use of silicon nitride in medical devices; |
| • | lower than expected clinical benefits in comparison with other products; |
12
| • | surgeons’ perception that there are insufficient advantages of our products relative to currently available products; |
| • | hospitals may choose not to purchase our products; |
| • | group purchasing organizations may choose not to contract for our products, thus limiting availability of our products to hospital purchasers; |
| • | the price of our products, which may be higher than products made of the other commonly used biomaterials in the interbody spinal fusion market and total joint market; |
| • | lack of coverage or adequate payment from managed care plans and other third-party payors for the procedures that use our products; |
| • | Medicare, Medicaid or other third-party payors may limit or not permit reimbursement for procedures using our products; |
| • | ineffective marketing and distribution support; |
| • | the time and resources that may be required for training, or the inadequate training, of surgeons in the proper use of our products; |
| • | the development of alternative biomaterials and products that render our products less competitive or obsolete; and |
| • | the development of or improvement of competitive products. |
If surgeons do not perceive our silicon nitride products and product candidates as superior alternatives to competing products, we will not be able to generate significant revenues, if any.
Even if surgeons are convinced of the superior characteristics of our silicon nitride products and our product candidates that we successfully introduce compared to the limitations of the current commonly used biomaterials, surgeons may find other methods or turn to other biomaterials besides silicon nitride to overcome such limitations. For instance, with respect to interbody spinal fusion products, surgeons or device manufacturers may use more effective markers for enhancing the imaging compatibility of PEEK devices, more effective antibiotics to prevent or treat implant-related infections, and more effective osteoconductive and osteoinductive materials when implanting an interbody spinal fusion device. Device manufacturers may also coat metal with existing traditional ceramics to reduce the risk of metal wear particles and corrosion in total joint replacement implants. Additionally, surgeons may increase their use of metal interbody spinal fusion devices if there is an increasing perception that PEEK devices are limited by their strength and resistance to fracture.
If we are unable to increase the productivity of our sales and marketing infrastructure we will not be able to penetrate the spinal fusion market.
We market and sell our products to surgeons and hospitals in the United States and select markets in Europe and South America using a network of independent third-party distributors who have existing surgeon relationships. We manage this distribution network through our in-house sales and marketing management team. We may also establish distribution collaborations in the United States and abroad in instances where access to a large or well-established sales and marketing organization may help to expand the market or accelerate penetration for selected products.
We cannot assure you that we will succeed in entering into and maintaining productive arrangements with an adequate number of distributors that are sufficiently committed to selling our products. The establishment of a distribution network is expensive and time consuming. As we launch new products and increase our marketing effort with respect to existing products, we will need to continue to hire, train, retain and motivate skilled independent distributors with significant technical knowledge in various areas, such as spinal fusion and total hip and knee joint replacement. In addition, the commissions we pay our distributors have increased over time, which has resulted in higher sales and marketing expenses, and those commissions and expenses may increase in the future. Furthermore, current and potential distributors may market and sell the products of our competitors. Even if the distributors market and sell our products, our competitors may be able, by offering higher commission payments or other incentives, to persuade these distributors to reduce or terminate their sales and marketing efforts related to our products. The distributors may also help competitors solicit business from our existing customers. Some of our independent distributors account for a significant portion of our sales volume, and, if we were to lose them, our sales could be adversely affected.
13
Even if we engage and maintain suitable relationships with an adequate number of distributors, they may not generate revenue as quickly as we expect them to, commit the necessary resources to effectively market and sell our products, or ultimately succeed in selling our products. We have been unable to obtain meaningful market share in the interbody spinal fusion device market with our current silicon nitride products to date and we may not be successful in increasing the productivity of our sales and marketing team and distribution network to gain meaningful market share for our silicon nitride products, which could adversely affect our business and financial condition.
The orthopedic market is highly competitive and we may not be able to compete effectively against the larger, well-established companies that dominate this market or emerging and small innovative companies that may seek to obtain or increase their share of the market.
The markets for spinal fusions and total hip and knee implant products are intensely competitive, and many of our competitors are much larger and have substantially more financial and human resources than we do. Many have long histories and strong reputations within the industry, and a relatively small number of companies dominate these markets. In 2012, Medtronic, Inc.; DePuy Synthes Companies, a group of Johnson & Johnson companies; Stryker Corporation; Biomet, Inc.; Zimmer Holdings, Inc.; and Smith & Nephew plc, accounted for more than 65% of orthopedic sales worldwide.
These companies enjoy significant competitive advantages over us, including:
| • | broad product offerings, which address the needs of orthopedic surgeons and hospitals in a wide range of procedures; |
| • | products that are supported by long-term clinical data; |
| • | greater experience in, and resources for, launching, marketing, distributing and selling products, including strong sales forces and established distribution networks; |
| • | existing relationships with spine and joint reconstruction surgeons; |
| • | extensive intellectual property portfolios and greater resources for patent protection; |
| • | greater financial and other resources for product research and development; |
| • | greater experience in obtaining and maintaining FDA and other regulatory clearances and approvals for products and product enhancements; |
| • | established manufacturing operations and contract manufacturing relationships; |
| • | significantly greater name recognition and widely recognized trademarks; and |
| • | established relationships with healthcare providers and payors. |
Our products and any product candidates that we may introduce into the market may not enable us to overcome the competitive advantages of these large and dominant orthopedic companies. In addition, even if we successfully introduce additional product candidates incorporating our silicon nitride biomaterial into the market, emerging and small innovative companies may seek to increase their market share and they may eventually possess competitive advantages, which could adversely impact our business. Our competitors may also employ pricing strategies that could adversely affect the pricing of our products and pricing in the spinal fusion and total joint replacement market generally.
Moreover, many other companies are seeking to develop new biomaterials and products which may compete effectively against our products in terms of performance and price. For example, Smith & Nephew has developed a ceramic-coated metal, known as Oxinium, that may overcome certain of the limitations of metal joint replacement products and could directly compete with our silicon nitride and silicon nitride-coated product candidates.
We have significant customer concentration, so that economic difficulties or changes in the purchasing policies or patterns of our key customers could have a significant impact on our business and operating results.
A small number of customers account for a substantial portion of our product revenues. Our customers are primarily hospitals and surgical centers. At September 30, 2013, our largest customer, Bon Secours St. Mary’s Hospital, or St. Mary’s, had a receivable balance of approximately 11% of our total trade accounts receivable. In addition, St. Mary’s accounted for 17% and 14% of our product revenues for the years ended December 31, 2011
14
and 2012, respectively, and 15% of our product revenues for the nine months ended September 30, 2013. Sales of our products to our customers, including St. Mary’s, are not based on long-term, committed-volume purchase contracts, and we may not continue to receive significant revenues from St. Mary’s or any customer. Because of our significant customer concentration, our revenue could fluctuate significantly due to changes in economic conditions, the use of competitive products, or the loss of, reduction of business with, or less favorable terms with St. Mary’s or any of our other significant customers. A significant portion of St. Mary’s’ purchases have been of our non-silicon nitride products, so it may be able to purchase competitive similar products from others. A reduction or delay in orders from St. Mary’s or any of our other significant customers, or a delay or default in payment by any significant customer, could materially harm our business and results of operations.
The manufacturing process for our silicon nitride products is complex and requires sophisticated state-of-the-art equipment, experienced manufacturing personnel and highly specialized knowledge. If we are unable to manufacture our silicon nitride products on a timely basis consistent with our quality standards, our results of operation will be adversely impacted.
In order to control the quality, cost and availability of our silicon nitride products, we developed our own manufacturing capabilities. We operate a 30,000 square foot manufacturing facility which is certified under the ISO 13485 medical device manufacturing standard for medical devices and operates under the FDA’s quality systems regulations, or QSRs. All operations with the exceptions of raw material production, cleaning, packaging and sterilization are performed at this facility.
We currently do not have a secondary source for the manufacture of our silicon nitride products. Our reliance solely on our internal resources to manufacture our silicon nitride products entails risks to which we would not be subject if we had secondary suppliers for their manufacture, including:
| • | the inability to meet our product specifications and quality requirements consistently; |
| • | a delay or inability to procure or expand sufficient manufacturing capacity to meet additional demand for our products; |
| • | manufacturing and product quality issues related to the scale-up of manufacturing; |
| • | the inability to produce a sufficient supply of our products to meet product demands; |
| • | the disruption of our manufacturing facility due to equipment failure, natural disaster or failure to retain key personnel; and |
| • | our inability to ensure our compliance with regulations and standards of the FDA including QSRs and corresponding state and international regulatory authorities. |
Any of these events could lead to a reduction in our product sales, product launch delays, failure to obtain regulatory clearance or approval or impact our ability to successfully sell our products and commercialize our products candidates. While we currently are experiencing an equipment repair and have been able to obtain product from a supplier in the interim, we may be unable to do so in the future. Some of these events could be the basis for adverse actions by regulatory authorities, including injunctions, recalls, seizures, or total or partial suspension of production. In November 2013, we entered into a cooperative research and development agreement with Kyocera Industrial Ceramics Corporation, or Kyocera, under which we will work with Kyocera to determine its ability to become a second qualified manufacturer of our silicon nitride-based spinal fusion products and product candidates. Although we expect this arrangement will lead to Kyocera becoming a secondary qualified manufacturer, if Kyocera fails to become a qualified manufacturer or if we cannot come to an agreement with Kyocera for the further manufacture of our silicon nitride-based spinal fusion products and product candidates, we will continue to be the sole manufacturer of these products and will need to seek other potential secondary manufacturers.
We depend on a limited number of third-party suppliers for key raw materials used in the manufacturing of our silicon nitride products, and the loss of these third-party suppliers or their inability to supply us with adequate raw materials could harm our business.
We rely on a limited number of third-party suppliers for the raw materials required for the production of our silicon nitride products and product candidates. Our dependence on a limited number of third-party suppliers involves several risks, including limited control over pricing, availability, quality, and delivery schedules for raw
15
materials. We have no supply agreements in place with any of our suppliers and cannot be certain that our current suppliers will continue to provide us with the quantities of raw materials that we require or that satisfy our anticipated specifications and quality requirements. Any supply interruption in limited or single sourced raw materials could materially harm our ability to manufacture our products until a new source of supply, if any, could be identified and qualified. We may be unable to find a sufficient alternative supply channel within a reasonable time or on commercially reasonable terms. Any performance failure on the part of our suppliers could delay the production of our silicon nitride products and product candidates and delay the development and commercialization of our product candidates, including limiting supplies necessary for commercial sale, clinical trials and regulatory approvals, which could have a material adverse effect on our business.
Use of third-party manufacturers increases the risk that we will not have adequate supplies of our non-silicon nitride products or instrumentation sets.
The majority of our product revenue is currently generated by sales of non-silicon nitride products. Our reliance on a limited number of third-party manufacturers to supply us with our non-silicon nitride products and instruments exposes us to risks that could delay our sales, or result in higher costs or lost product revenues. In particular, our manufacturers could:
| • | encounter difficulties in achieving volume production, quality control and quality assurance or suffer shortages of qualified personnel, which could result in their inability to manufacture sufficient quantities of our commercially available non-silicon nitride products to meet market demand for those products, or they could experience similar problems that result in the manufacture of insufficient quantities of our non-silicon nitride product candidates; and |
| • | fail to follow and remain in compliance with the FDA-mandated QSRs, compliance which is required for all medical devices, or fail to document their compliance to QSRs, either of which could lead to significant delays in the availability of materials for our non-silicon nitride products or instrumentation sets. |
If we are unable to obtain adequate supplies of our non-silicon nitride products and related instrumentation sets that meet our specifications and quality standards, it will be difficult for us to compete effectively. We have no supply agreements in place with our manufacturers and they may change the terms of our future orders or choose not to supply us with products or instrumentation sets in the future. Furthermore, if a third-party manufacturer from whom we purchase fails to perform its obligations, we may be forced to purchase products or related instrumentation from other third-party manufacturers, which we may not be able to do on reasonable terms, if at all. In addition, if we are required to change manufacturers for any reason, we will be required to verify that the new manufacturer maintains facilities and procedures that comply with quality standards and with all applicable regulations and guidelines. The delays associated with the verification of a new manufacturer or the re-verification of an existing manufacturer could negatively affect our ability to produce and distribute our non-silicon nitride products or instruments in a timely manner.
In order to be successful, we must expand our available product lines of silicon nitride-based medical devices by commercializing new product candidates, but we may not be able to do so in a timely fashion and at expected costs, or at all.
Although we are currently marketing our silicon nitride interbody spinal fusion implants, in order to be successful, we will need to expand our product lines to include other silicon nitride devices. Therefore, we are developing silicon nitride product candidates for total hip and knee replacement procedures and are exploring the application of our silicon nitride technology for other potential applications. However, we have yet to commercialize any silicon nitride products beyond our spinal fusion products. To succeed in our commercialization efforts, we must effectively continue product development and testing, obtain regulatory clearances and approvals, and enhance our sales and marketing capabilities. We may also have to write down significant inventory if existing products are replaced by new products. Because of these uncertainties, there is no assurance that we will succeed in bringing any of our current or future product candidates to market. If we fail in bringing our product candidates to market, or experience delays in doing so, we will not generate revenues as planned and will need to curtail operations or seek additional financing earlier than otherwise anticipated.
16
We will depend on one or more strategic partners to develop and commercialize our total joint replacement product candidates, and if our strategic partners are unable to execute effectively on our agreements with them, we may never become profitable.
Pursuant to a joint development and license agreement with Orthopaedic Synergy, Inc., or OSI, we are dependent on OSI’s ability to execute product development plans, obtain regulatory approvals, and sell, distribute and market our jointly developed product candidate for total hip and total knee joint replacement implants that use our MC2 silicon nitride technology. We would similarly be reliant on other strategic partners to develop and commercialize a total hip or knee joint replacement product candidate that utilizes silicon nitride-coated components, although we have not yet entered into an agreement with any strategic partner to develop products with these silicon nitride-coated components and may be unable to do so on agreeable terms. In order to succeed in our joint commercialization efforts, we and OSI, and any future partners must execute effectively on all elements of a combined business plan, including continuing to establish sales and marketing capabilities, manage certified, validated and effective commercial-scale manufacturing operations, conduct product development and testing, and obtain regulatory clearances and approvals for our product candidate. If we or any of our strategic partners fail in any of these endeavors, or experience delays in pursuing them, we will not generate revenues as planned and will need to curtail operations or seek additional financing earlier than otherwise anticipated.
The use of physician-owned distributorships could result in increased pricing pressure on our products or harm our ability to sell our products to physicians who own or are affiliated with those distributorships and the sale of our products through such distributorships may expose us to regulatory enforcement risk.
Physician-owned distributorships, or PODs, are medical device distributors that are owned, directly or indirectly, by physicians. These physicians derive a proportion of their revenue from selling or arranging for the sale of medical devices for use in procedures they perform on their own patients at hospitals that agree to purchase from or through the POD, or that otherwise furnish ordering physicians with income that is based directly or indirectly on those orders of medical devices.
We may sell and distribute our products through a limited number of PODs. The number of PODs in the orthopedic industry may continue to grow as physicians search for ways to increase their incomes. These companies and the physicians who own, or partially own, them have significant market knowledge and access to the surgeons and hospitals that may potentially purchase our products and the physicians who own these PODs will have financial incentives to purchase from these distributorships. As a result, growth in this area may reduce our ability to compete effectively for business.
On March 26, 2013, the Department of Health and Human Services Office of Inspector General issued a Special Fraud Alert on Physician-Owned Entities and identified PODs as “inherently suspect” under the federal Anti-Kickback Statute. While the PODs themselves may be the target of any government enforcement efforts in this area, it is possible that regulatory scrutiny may extend to other entities that have relationships with PODs, including us. We are not aware that we are currently subject to any such scrutiny. However, the cost of defending such enforcement actions, if brought (even without merit), as well as any sanctions, if imposed, could have a material adverse effect on our business.
If hospitals and other healthcare providers are unable to obtain coverage or adequate reimbursement for procedures performed with our products, it is unlikely our products will be widely used.
In the United States, the commercial success of our existing products and any future products will depend, in part, on the extent to which governmental payors at the federal and state levels, including Medicare and Medicaid, private health insurers and other third-party payors provide coverage for and establish adequate reimbursement levels for procedures utilizing our products. Because we typically receive payment directly from hospitals and surgical centers, we do not anticipate relying directly on payment from third-party payors for our products. However, hospitals and other healthcare providers that purchase our orthopedic products for treatment of their patients generally rely on third-party payors to pay for all or part of the costs and fees associated with our products as part of a “bundled” rate for the associated procedures. The existence of coverage and adequate reimbursement for our products and the procedures performed with them by government and private payors is
17
critical to market acceptance of our existing and future products. Neither hospitals nor surgeons are likely to use our products if they do not receive adequate reimbursement for the procedures utilizing our products.
Many private payors currently base their reimbursement policies on the coverage decisions and payment amounts determined by the Centers for Medicare and Medicaid Services, or CMS, which administers the Medicare program. Others may adopt different coverage or reimbursement policies for procedures performed with our products, while some governmental programs, such as Medicaid, have reimbursement policies that vary from state to state, some of which may not pay for the procedures performed with our products in an adequate amount, if at all. A Medicare national or local coverage decision denying coverage for one or more of our products could result in private and other third-party payors also denying coverage for our products. Third-party payors also may deny reimbursement for our products if they determine that a product used in a procedure was not medically necessary, was not used in accordance with cost-effective treatment methods, as determined by the third-party payor, or was used for an unapproved use. Unfavorable coverage or reimbursement decisions by government programs or private payors underscore the uncertainty that our products face in the market and could have a material adverse effect on our business.
Many hospitals and clinics in the United States belong to group purchasing organizations, which typically incentivize their hospital members to make a relatively large proportion of purchases from a limited number of vendors of similar products that have contracted to offer discounted prices. Such contracts often include exceptions for purchasing certain innovative new technologies, however. Accordingly, the commercial success of our products may also depend to some extent on our ability to either negotiate favorable purchase contracts with key group purchasing organizations and/or persuade hospitals and clinics to purchase our product “off contract.”
The healthcare industry in the United States has experienced a trend toward cost containment as government and private payors seek to control healthcare costs by paying service providers lower rates. While it is expected that hospitals will be able to obtain coverage for procedures using our products, the level of payment available to them for such procedures may change over time. State and federal healthcare programs, such as Medicare and Medicaid, closely regulate provider payment levels and have sought to contain, and sometimes reduce, payment levels. Private payors frequently follow government payment policies and are likewise interested in controlling increases in the cost of medical care. In addition, some payors are adopting pay-for-performance programs that differentiate payments to healthcare providers based on the achievement of documented quality-of-care metrics, cost efficiencies, or patient outcomes. These programs are intended to provide incentives to providers to deliver the same or better results while consuming fewer resources. As a result of these programs, and related payor efforts to reduce payment levels, hospitals and other providers are seeking ways to reduce their costs, including the amounts they pay to medical device manufacturers. We may not be able to sell our implants profitably if third-party payors deny or discontinue coverage or reduce their levels of payment below that which we project, or if our production costs increase at a greater rate than payment levels. Adverse changes in payment rates by payors to hospitals could adversely impact our ability to market and sell our products and negatively affect our financial performance.
In international markets, medical device regulatory requirements and healthcare payment systems vary significantly from country to country, and many countries have instituted price ceilings on specific product lines. We cannot assure you that our products will be considered cost-effective by international third-party payors, that reimbursement will be available or, if available, that the third-party payors’ reimbursement policies will not adversely affect our ability to sell our products profitably. Any failure to receive regulatory or reimbursement approvals would negatively impact market acceptance of our products in any international markets in which those approvals are sought.
Prolonged negative economic conditions in domestic and international markets may adversely affect us, our suppliers, partners and consumers, and the global orthopedic market which could harm our financial position.
Global credit and financial markets have been experiencing extreme disruptions over the past several years, including severely diminished liquidity and availability of credit, declines in consumer confidence, declines in economic growth, increases in unemployment rates and uncertainty about economic stability. Credit and financial markets and confidence in economic conditions might deteriorate further. Our business may be adversely affected by the recent economic downturn and volatile business environment and continued unpredictable and unstable market conditions. In addition, there is a risk that one or more of our current suppliers
18
may not continue to operate. Any lender that is obligated to provide funding to us under any future credit agreement with us may not be able to provide funding in a timely manner, or at all, when we require it. The cost of, or lack of, available credit or equity financing could impact our ability to develop sufficient liquidity to maintain or grow our company. These negative changes in domestic and international economic conditions or additional disruptions of either or both of the financial and credit markets may also affect third-party payors and may have a material adverse effect on our business, results of operations, financial condition and liquidity.
In addition, we believe that various demographics and industry-specific trends will help drive growth in the orthopedics markets, but these demographics and trends are uncertain. Actual demand for orthopedic products generally, and our products in particular, could be significantly less than expected if our assumptions regarding these factors prove to be incorrect or do not materialize, or if alternative treatments gain widespread acceptance.
We have a new senior management team and are dependent on our senior management team, engineering team, sales and marketing team and surgeon advisors, and the loss of any of them could harm our business.
We have recently assembled a new senior management team. They have worked together in their new positions with us for a limited time and may not be able to successfully implement our strategy. In addition, we have not entered into employment agreements, other than severance agreements, with any of the members of our senior management team. There are no assurances that the services of any of these individuals will be available to us for any specified period of time. The successful integration of our new senior management team, the loss of members of our senior management team, sales and marketing team, engineering team and key surgeon advisors, or our inability to attract or retain other qualified personnel or advisors could have a material adverse effect on our business, financial condition and results of operations.
If we experience significant disruptions in our information technology systems, our business, results of operations and financial condition could be adversely affected.
The efficient operation of our business depends on our information technology systems. We rely on our information technology systems to effectively manage our sales and marketing, accounting and financial functions; manufacturing processes; inventory; engineering and product development functions; and our research and development functions. As such, our information technology systems are vulnerable to damage or interruption including from earthquakes, fires, floods and other natural disasters; terrorist attacks and attacks by computer viruses or hackers; power losses; and computer systems, or Internet, telecommunications or data network failures. The failure of our information technology systems to perform as we anticipate or our failure to effectively implement new systems could disrupt our entire operation and could result in decreased sales, increased overhead costs, excess inventory and product shortages, all of which could have a material adverse effect on our reputation, business, results of operations and financial condition.
Risks Related to Our Capital Resources and Impairments
We may require additional financing and our failure to obtain additional funding when needed could force us to delay, reduce or eliminate our product development programs or commercialization efforts.
We may require substantial future capital in order to continue to conduct the research and development and regulatory clearance and approval activities necessary to bring our products to market and to establish effective marketing and sales capabilities. Our existing capital resources and the net proceeds from this offering may not be sufficient to enable us to fund the completion of the development and commercialization of all of our product candidates. We cannot determine with certainty the duration and completion costs of the current or future development and commercialization of our product candidates for spinal fusion procedures, joint replacement and coated metals or if, when, or to what extent we will generate revenues from the commercialization and sale of any of these product candidates for which we obtain regulatory approval. We may never succeed in achieving regulatory approval for certain of these product candidates. The duration, costs and timing of clinical trials and development of our spinal fusion, joint replacement and coated metal product candidates will depend on a variety of factors, including:
| • | the scope, rate of progress, and expense of our ongoing, as well as any additional, clinical trials and other research and development activities; |
19
| • | future clinical trial results we may have to conduct; |
| • | potential changes in government regulation; and |
| • | the timing and receipt of any regulatory approvals. |
A change in the outcome of any of these variables with respect to the development of spinal fusion, joint replacement or coated metal product candidates could mean a significant change in the costs and timing associated with the development of these product candidates. We believe that our existing capital resources, expected product revenues, and the net proceeds from this offering will enable us to maintain currently planned activities associated with the research, development, regulatory approval and commercialization activities for these product candidates over the next 15 months, which we expect will approximate $3.4 million of the expected $8.0 million of such expenses for all of our products and product candidates over this period.
We currently have limited committed sources of capital and we have limited liquidity. Our cash and cash equivalents as of September 30, 2013 were $7.6 million and as of December 31, 2012 were $2.7 million. In December 2012, we entered into a senior secured credit facility with General Electric Capital Corporation, or GE Capital, as agent and lender, and Zions First National Bank, as lender, which is described in more detail in the “Management’s Discussion and Analysis of Financial Condition and Results of Operations” section of this prospectus and which we refer to as the GE Secured Lending Facility. The GE Secured Lending Facility consists of a $18.0 million 30-month term loan and a $3.5 million revolving credit facility. The revolving line of credit is secured by our accounts receivable, based on certain defined criteria. We began monthly repayment of the principal amount due under the term loan in January 2014. Due to the amortization of our term loan, we expect to use a substantial amount of our monthly cash flow to repay the GE Secured Lending Facility.
The GE Secured Lending Facility contains certain financial covenants related to monthly cash burn, as defined in the revolving credit facility, minimum liquidity, days sales outstanding of accounts receivable balances, annual payment restrictions to certain company affiliates and other financial reporting requirements. Specifically, under the liquidity covenant in the revolving credit facility, we are required to maintain cash and cash equivalents and availability under the GE Secured Lending Facility of equal to the greater of $1.5 million (exclusive of availability under the revolving credit facility) or six times our monthly cash burn. We were in default of this liquidity covenant in November 2013 and, in December 2013, we obtained a waiver of this liquidity covenant from November 1, 2013 through January 31, 2014 and agreed to increase the credit reserve under this facility from $0.5 million to $1.0 million. On January 28, 2014, we obtained an additional waiver of the liquidity covenant from GE Capital through February 28, 2014 and agreed to increase the credit reserve under this facility by an additional $0.5 million, bringing the total reserve to $1.5 million. In addition, the repayment of the GE Secured Lending Facility and the liquidity covenant limit our ability to use our cash and cash equivalents to fund our operations and may restrict our ability to continue development of our product candidates. Additionally, our GE Secured Lending Facility restricts our ability to incur additional pari passu indebtedness, which may reduce our ability to seek additional financing. Additional funds may not be available when we need them on terms that are acceptable to us, or at all. If adequate funds are not available on a timely basis, we may terminate or delay the development of one or more of our product candidates, or delay activities necessary to commercialize our product candidates.
We expect that our existing capital resources, expected product revenue and the net proceeds from this offering will enable us to maintain currently planned operations at least through the next 15 months. However, our operating plan may change, and we may need additional funds sooner than anticipated to meet our operational needs and capital requirements for product development, clinical trials and commercialization. Our future capital requirements will depend on many factors, including:
| • | the level of sales of our current products and the cost of revenue and sales and marketing; |
| • | the extent of any clinical trials that we will be required to conduct in support of the regulatory clearance of our total hip and knee replacement product candidates; |
| • | the scope, progress, results and cost of our product development efforts; |
| • | the costs, timing and outcomes of regulatory reviews of our product candidates; |
| • | the number and types of products we develop and commercialize; |
20
| • | the costs of preparing, filing and prosecuting patent applications and maintaining, enforcing and defending intellectual property-related claims; and |
| • | the extent and scope of our general and administrative expenses. |
Raising additional capital by issuing securities or through debt financings or licensing arrangements may cause dilution to existing stockholders, restrict our operations or require us to relinquish proprietary rights.
To the extent that we raise additional capital through the sale of equity or convertible debt securities, your ownership interest will be diluted, and the terms may include liquidation or other preferences that adversely affect your rights as a stockholder. Debt financing, if available, may involve agreements that include covenants limiting or restricting our ability to take specific actions such as incurring additional debt, making capital expenditures or declaring dividends. If we raise additional funds through collaboration and licensing arrangements with third parties, we may have to relinquish valuable rights to our technologies or products or grant licenses on terms that are not favorable to us. Any of these events could adversely affect our ability to achieve our product development and commercialization goals and have a material adverse effect on our business, financial condition and results of operations.
Our independent registered public accounting firm has included an explanatory paragraph relating to our ability to continue as a going concern in its report on our audited financial statements. We may be unable to continue to operate without the threat of liquidation for the foreseeable future.
Our report from our independent registered public accounting firm for the year ended December 31, 2012 includes an explanatory paragraph stating that our recurring losses from operations and net capital deficiency raise substantial doubt about our ability to continue as a going concern. If we are unable to obtain sufficient funding, our business, prospects, financial condition and results of operations will be materially and adversely affected and we may be unable to continue as a going concern. For example, without the expected proceeds from this offering, our existing capital resources will be insufficient to fund our operations through the end of February 2014. If we are unable to continue as a going concern, we may have to liquidate our assets and may receive less than the value at which those assets are carried on our consolidated financial statements, and it is likely that investors will lose all or a part of their investment. Future reports from our independent registered public accounting firm may also contain statements expressing doubt about our ability to continue as a going concern. If we seek additional financing to fund our business activities in the future and there remains doubt about our ability to continue as a going concern, investors or other financing sources may be unwilling to provide additional funding on commercially reasonable terms or at all.
An impairment charge could have a material adverse effect on our financial condition and results of operations.
We are required to test acquired goodwill for impairment on an annual basis. Goodwill represents the excess of the amount paid over the fair value of the net assets at the date of the acquisition. We have chosen to complete our annual impairment reviews of goodwill at the end of each calendar year. We also are required to test goodwill for impairment between annual tests if events occur or circumstances change that would more likely than not reduce our enterprise fair value below its book value. In addition, we are required to test our finite-lived intangible assets for impairment if events occur or circumstances change that would indicate the remaining net book value of the finite-lived intangible assets might not be recoverable. These events or circumstances could include a significant change in the business climate, including a significant sustained decline in our market value, legal factors, operating performance indicators, competition, sale or disposition of a significant portion of our business and other factors.
If the fair market value of our reporting unit is less than its book value, we could be required to record an impairment charge. The valuation of a reporting unit requires judgment in estimating future cash flows, discount rates and other factors. In making these judgments, we evaluate the financial health of our business, including such factors as industry performance, changes in technology and operating cash flows. Changes in our forecasts or decreases in the value of our common stock could cause book values of our reporting unit to exceed its fair value, which may result in goodwill impairment charges. The amount of any impairment could be significant and could have a material adverse effect on our reported financial results for the period in which the charge is taken.
21
Risks Related to Regulatory Approval of Our Products and Other Government Regulations
Our long-term success depends substantially on our ability to obtain regulatory clearance or approval and thereafter commercialize our product candidates; we cannot be certain that we will be able to do so in a timely manner or at all.
The process of obtaining regulatory clearances or approvals to market a medical device from the FDA or similar regulatory authorities outside of the United States can be costly and time consuming, and there can be no assurance that such clearances or approvals will be granted on a timely basis, or at all. The FDA’s 510(k) clearance process generally takes one to six months from the date of submission, depending on whether a special or traditional 510(k) premarket notification has been submitted, but can take significantly longer. An application for premarket approval, or PMA, must be submitted to the FDA if the device cannot be cleared through the 510(k) clearance process or is not exempt from premarket review by the FDA. The PMA process almost always requires one or more clinical trials and can take two to three years from the date of filing, or even longer. In some cases, including in the case of our interbody spinal fusion devices which incorporate our CSC technology and our MC2 silicon nitride femoral head component, the FDA requires clinical data as part of the 510(k) clearance process.
It is possible that the FDA could raise questions about our spinal fusion products, our spinal fusion product candidates and our total hip and knee joint replacement product candidates and could require us to perform additional studies on our products and product candidates. Even if the FDA permits us to use the 510(k) clearance process, we cannot assure you that the FDA will not require either supporting data from laboratory tests or studies that we have not conducted, or substantial supporting clinical data. If we are unable to use the 510(k) clearance process for any of our product candidates, are required to provide clinical data or laboratory data that we do not possess to support our 510(k) premarket notifications for any of these product candidates, or otherwise experience delays in obtaining or fail to obtain regulatory clearances, the commercialization of our product candidates in the United States will be delayed or prevented, which will adversely affect our ability to generate additional revenues. It also may result in the loss of potential competitive advantages that we might otherwise attain by bringing our products to market earlier than our competitors. Additionally, although the FDA allows modifications to be made to devices that have received 510(k) clearance with supporting documentation, the FDA may disagree with our decision to modify our cleared devices without submission of a new 510(k) premarket notification, subjecting us to potential product recall, field alerts and corrective actions. Any of these contingencies could adversely affect our business.
Similar to our compliance with U.S. regulatory requirements, we must obtain and comply with international clearances and approvals in order to market and sell our products outside of the United States and we may only promote and market our products, if approved, as permitted by the applicable regulatory body.
The safety of our products is not yet supported by long-term clinical data, and they may prove to be less safe and effective than our laboratory data indicate.
We obtained FDA clearance for each of our products that we currently market, and we have sought and intend to seek CE Marking and FDA clearance or approval through the FDA’s 510(k) or PMA process for our product candidates. The 510(k) clearance process is based on the FDA’s agreement that a new product candidate is substantially equivalent to an already marketed product for which a PMA was not required. While most 510(k) premarket notifications do not require clinical data for clearance, the FDA may request that such data be provided. Long-term clinical data or marketing experience obtained after clearance may indicate that our products cause unexpected complications or other unforeseen negative effects. If this happens, we could be subject to the withdrawal of our marketing clearance and other enforcement sanctions by the FDA or other regulatory authority, product recalls, significant legal liability, significant negative publicity, damage to our reputation and a dramatic reduction in our ability to sell our products, any one of which would have a material adverse effect on our business, financial condition and results of operations.
22
We expect to be required to conduct clinical trials to support regulatory approval of some of our product candidates. We have no experience conducting clinical trials, they may proceed more slowly than anticipated, and we cannot be certain that our product candidates will be shown to be safe and effective for human use.
In order to commercialize our product candidates in the United States, we must submit a PMA for some of these product candidates, which will require us to conduct clinical trials. We also plan to provide the FDA with clinical trial data to support some of our 510(k) premarket notifications. We will receive approval or clearance from the FDA to commercialize products requiring a clinical trial only if we can demonstrate to the satisfaction of the FDA, through well-designed and properly conducted clinical trials, that our product candidates are safe and effective and otherwise meet the appropriate standards required for approval or clearance for specified indications. Clinical trials are complex, expensive, time consuming, uncertain and subject to substantial and unanticipated delays. Before we may begin clinical trials, we must submit and obtain approval for an investigational device exemption, or IDE, that describes, among other things, the manufacture of, and controls for, the device and a complete investigational plan. Clinical trials generally involve a substantial number of patients in a multi-year study. Because we do not have the experience or the infrastructure necessary to conduct clinical trials, we will have to hire one or more contract research organizations, or CROs, to conduct trials on our behalf. CRO contract negotiations may be costly and time consuming and we will rely heavily on the CRO to ensure that our trials are conducted in accordance with regulatory and industry standards. We may encounter problems with our clinical trials and any of those problems could cause us or the FDA to suspend those trials, or delay the analysis of the data derived from them.
A number of events or factors, including any of the following, could delay the completion of our clinical trials in the future and negatively impact our ability to obtain FDA approval for, and to introduce our product candidates:
| • | failure to obtain financing necessary to bear the cost of designing and conducting clinical trials; |
| • | failure to obtain approval from the FDA or foreign regulatory authorities to commence investigational studies; |
| • | conditions imposed on us by the FDA or foreign regulatory authorities regarding the scope or design of our clinical trials; |
| • | failure to find a qualified CRO to conduct our clinical trials or to negotiate a CRO services agreement on favorable terms; |
| • | delays in obtaining or in our maintaining required approvals from institutional review boards or other reviewing entities at clinical sites selected for participation in our clinical trials; |
| • | insufficient supply of our product candidates or other materials necessary to conduct our clinical trials; |
| • | difficulties in enrolling patients in our clinical trials; |
| • | negative or inconclusive results from clinical trials, or results that are inconsistent with earlier results, that necessitate additional clinical studies; |
| • | failure on the part of the CRO to conduct the clinical trial in accordance with regulatory requirements; |
| • | our failure to maintain a successful relationship with the CRO or termination of our contractual relationship with the CRO before completion of the clinical trials; |
| • | serious or unexpected side effects experienced by patients in whom our product candidates are implanted; or |
| • | failure by any of our third-party contractors or investigators to comply with regulatory requirements or meet other contractual obligations in a timely manner. |
Our clinical trials may need to be redesigned or may not be completed on schedule, if at all. Delays in our clinical trials may result in increased development costs for our product candidates, which could cause our stock price to decline and limit our ability to obtain additional financing. In addition, if one or more of our clinical trials are delayed, competitors may be able to bring products to market before we do, and the commercial viability of our product candidates could be significantly reduced.
23
Our current and future relationships with third-party payors and current and potential customers in the United States and elsewhere may be subject, directly or indirectly, to applicable anti-kickback, fraud and abuse, false claims, transparency, health information privacy and security and other healthcare laws and regulations, which could expose us to criminal sanctions, civil penalties, contractual damages, reputational harm administrative burdens and diminished profits and future earnings.
Our current and future arrangements with third-party payors and current and potential customers, including providers and physicians, as well as PODs, as discussed above, may expose us to broadly applicable fraud and abuse and other healthcare laws and regulations, including, without limitation, the federal Anti-Kickback Statute and the federal False Claims Act, which may constrain the business or financial arrangements and relationships through which we sell, market and distribute our products. In addition, we may be subject to transparency laws and patient privacy regulations by U.S. federal and state governments and by governments in foreign jurisdictions in which we conduct our business. The applicable federal, state and foreign healthcare laws and regulations that may affect our ability to operate include:
| • | the federal Anti-Kickback Statute, which prohibits, among other things, persons from knowingly and willfully soliciting, offering, receiving or providing remuneration, directly or indirectly, in cash or in kind, to induce or reward, or in return for, either the referral of an individual for, or the purchase, order or recommendation of, any good or service, for which payment may be made under federal healthcare programs, such as Medicare and Medicaid; |
| • | federal civil and criminal false claims laws and civil monetary penalty laws, including the federal False Claims Act, which impose criminal and civil penalties, including civil whistleblower or qui tam actions, against individuals or entities for knowingly presenting, or causing to be presented, to the federal government, including the Medicare and Medicaid programs, claims for payment that are false or fraudulent or making a false statement to avoid, decrease or conceal an obligation to pay money to the federal government; |
| • | the federal Health Insurance Portability and Accountability Act of 1996, or HIPAA, which imposes criminal and civil liability for executing a scheme to defraud any healthcare benefit program or making false statements relating to healthcare matters; |
| • | HIPAA, as amended by the Health Information Technology for Economic and Clinical Health Act of 2009, or HITECH, and their respective implementing regulations, which impose obligations on covered healthcare providers, health plans, and healthcare clearinghouses, as well as their business associates that create, receive, maintain or transmit individually identifiable health information for or on behalf of a covered entity, with respect to safeguarding the privacy, security and transmission of individually identifiable health information; |
| • | the Physician Payments Sunshine Act, which requires (i) manufacturers of drugs, devices, biologics and medical supplies for which payment is available under Medicare, Medicaid or the Children’s Health Insurance Program, with specific exceptions, to report annually to CMS information related to certain “payments or other transfers of value” made to physicians, which is defined to include doctors, dentists, optometrists, podiatrists and chiropractors, and teaching hospitals, with data collection beginning on August 1, 2013, (ii) applicable manufacturers and applicable group purchasing organizations to report annually to CMS ownership and investment interests held in such entities by physicians and their immediate family members, with data collection beginning on August 1, 2013, (iii) manufacturers to submit reports to CMS by March 31, 2014 and the 90th day of each subsequent calendar year, and (iv) disclosure of such information by CMS on a publicly available website beginning in September 2014; and |
| • | analogous state and foreign laws and regulations, such as state anti-kickback and false claims laws, which may apply to sales or marketing arrangements and claims involving healthcare items or services reimbursed by non-governmental third-party payors, including private insurers; state and foreign laws that require medical device companies to comply with the medical device industry’s voluntary compliance guidelines and the relevant compliance guidance promulgated by the federal government or otherwise restrict payments that may be made to healthcare providers; state and foreign laws that require medical device manufacturers to report information related to payments and other transfers of value to physicians and other healthcare providers or marketing expenditures; and state and foreign laws governing the privacy and security of health information in certain circumstances, many of which differ from each other in significant ways and often are not preempted by HIPAA, thus complicating compliance efforts. |
24
Efforts to ensure that our business arrangements with third parties will comply with applicable healthcare laws and regulations may involve substantial costs. It is possible that governmental authorities will conclude that our business practices may not comply with current or future statutes, regulations or case law involving applicable fraud and abuse or other healthcare laws and regulations. If our operations are found to be in violation of any of these laws or any other governmental regulations that may apply to us, we may be subject to significant civil, criminal and administrative penalties, including, without limitation, damages, fines, imprisonment, exclusion from participation in government healthcare programs, such as Medicare and Medicaid, and the curtailment or restructuring of our operations, which could have a material adverse effect on our business. If any of the physicians or other healthcare providers or entities with whom we expect to do business, including our collaborators, are found not to be in compliance with applicable laws, they may be subject to criminal, civil or administrative sanctions, including exclusions from participation in government healthcare programs, which could also materially affect our business.
In July 2012, we received a subpoena from the Department of Justice seeking the production of documents, including documents related to our relationship with a particular customer and various entities, including a company distributor, and individuals associated with that distributor. In April 2013, we received a second subpoena requesting similar records. We cooperated with the Department of Justice’s requests and provided the records requested by the two subpoenas. We have had no further communications with the Department of Justice since responding to its second request in June 2013. While we do not believe that we are the target of the government’s investigation, if we are found to have violated one or more applicable laws, we could be subject to the risks and consequences discussed above. In addition, responding to any additional requests or actions of the Department of Justice in connection with this investigation may be expensive and time-consuming.
Recently enacted and future legislation may increase the difficulty and cost for us to obtain regulatory approval or clearance of our product candidates and affect the prices we may obtain for our products.
In the United States and some foreign jurisdictions, there have been a number of legislative and regulatory changes and proposed changes regarding the healthcare system that could prevent or delay clearance and/or approval of our product candidates, restrict or regulate post-clearance and post-approval activities and affect our ability to profitably sell our products and any product candidates for which we obtain marketing approval or clearance.
In addition, FDA regulations and guidance are often revised or reinterpreted by the FDA in ways that may significantly affect our business and our products. Any new regulations or revisions or reinterpretations of existing regulations may impose additional costs or lengthen review times of our products. Delays in receipt of or failure to receive regulatory clearances or approvals for our new products would have a material adverse effect on our business, results of operations and financial condition. In addition, the FDA is currently evaluating the 510(k) process and may make substantial changes to industry requirements, including which devices are eligible for 510(k) clearance, the ability to rescind previously granted 510(k) clearances and additional requirements that may significantly impact the process.
Among policy makers and payors in the United States and elsewhere, there is significant interest in promoting changes in healthcare systems with the stated goals of containing healthcare costs, improving quality and expanding access. In the United States, the medical device industry has been a particular focus of these efforts and has been significantly affected by major legislative initiatives. In March 2010, President Obama signed into law the Patient Protection and Affordable Care Act, as amended by the Health Care and Education Affordability Reconciliation Act, or collectively the ACA, a sweeping law intended, among other things, to broaden access to health insurance, reduce or constrain the growth of healthcare spending, enhance remedies against fraud and abuse, add new transparency requirements for the healthcare and health insurance industries, impose new taxes and fees on the health industry and impose additional health policy reforms.
Among the provisions of the ACA of importance to our products and product candidates are:
| • | a 2.3% medical device excise tax on certain transactions, including many U.S. sales of medical devices, which currently includes and we expect will continue to include U.S. sales of our products and products candidates that receive clearance or approval; |
25
| • | expansion of healthcare fraud and abuse laws, including the False Claims Act and the Anti-Kickback Statute, and new government investigative powers and enhanced penalties for non-compliance; |
| • | new requirements under the federal Open Payments program and its implementing regulations; |
| • | a new Patient-Centered Outcomes Research Institute to oversee, identify priorities in, and conduct comparative clinical effectiveness research, along with funding for such research; and |
| • | creation of an independent payment advisory board that will submit recommendations to reduce Medicare spending if projected Medicare spending exceeds a specified growth rate. |
In addition, other legislative changes have been proposed and adopted since the ACA was enacted. For example, on August 2, 2011, the President signed into law the Budget Control Act of 2011, which, among other things, created the Joint Select Committee on Deficit Reduction to recommend to Congress proposals in spending reductions. The Joint Select Committee on Deficit Reduction did not achieve a targeted deficit reduction of at least $1.2 trillion for the years 2013 through 2021, triggering the legislation’s automatic reduction to several government programs. This includes aggregate reductions to Medicare payments to providers of up to 2% per fiscal year, starting in 2013. On January 2, 2013, President Obama signed into law the American Taxpayer Relief Act of 2012, or ATRA, which, among other things, reduced Medicare payments to several types of providers and increased the statute of limitations period for the government to recover overpayments to providers from three to five years. On March 1, 2013, the President signed an executive order implementing the Budget Control Act’s 2% Medicare payment reductions, and on April 1, 2013, these reductions went into effect. These new laws may result in additional reductions in Medicare and other healthcare funding, which could have a material adverse effect on our financial operations.
We expect that the ACA, as well as other healthcare reform measures that have been and may be adopted in the future, may result in more rigorous coverage criteria and in additional downward pressure on the price that we receive for our products. Any reduction in reimbursement from Medicare or other government programs may result in a similar reduction in payments from private payors. The implementation of cost containment measures or other healthcare reforms may affect our ability to generate revenue and profits or commercialize our product candidates.
In the European Union and some other international markets, the government provides health care at a low cost to consumers and regulates prices of healthcare products, patient eligibility or reimbursement levels to control costs for the government-sponsored health care system. Many countries are reducing their public expenditures and we expect to see strong efforts to reduce healthcare costs in international markets, including patient access restrictions, suspensions on price increases, prospective and possibly retroactive price reductions and other recoupments and increased mandatory discounts or rebates and recoveries of past price increases. These cost control measures could reduce our revenues. In addition, certain countries set prices by reference to the prices in other countries where our products are marketed. Thus, our inability to secure adequate prices in a particular country may not only limit the marketing of our products within that country, but may also adversely affect our ability to obtain acceptable prices in other markets. This may create the opportunity for third-party cross border trade or influence our decision to sell or not to sell a product, thus adversely affecting our geographic expansion plans and revenues.
The U.S. federal medical device excise tax may materially adversely affect our business and results of operations, and we may be subject to increased taxes in other jurisdictions.
The ACA imposed a 2.3% federal medical device excise tax on the sales in the United States of most medical devices. Most if not all of our products will be subject to this tax. This excise tax became effective in 2013 and has forced, and will continue to force us to identify ways to reduce spending in other areas to offset the expected earnings impact due to the tax. We do not expect to be able to pass along the cost of this tax to hospitals, which continue to face cuts to their Medicare reimbursement due to the ACA and the recently enacted ATRA. Nor do we expect to be able to offset the cost of the tax through higher sales volumes resulting from the expansion of health insurance coverage because of the demographics of the current uninsured population in the United States. While it is still too early to fully understand and predict the ultimate impact of the medical device tax on our business, ongoing implementation of this legislation and any similar taxes imposed in other jurisdictions could have a material adverse effect on our results of operations and cash flows.
26
Risks Related to Our Intellectual Property and Litigation
If the combination of patents, trade secrets and contractual provisions that we rely on to protect our intellectual property is inadequate, our ability to commercialize our orthopedic products successfully will be harmed, and we may not be able to operate our business profitably.
Our success depends significantly on our ability to protect our proprietary rights to the technologies incorporated in our products. We currently have 34 issued U.S. patents, 38 pending U.S. patent applications, 11 granted foreign patents and 18 pending foreign patent applications. Our issued patents begin to expire in 2014, with the last of these patents expiring in 2031. We rely on a combination of patent protection, trade secret laws and nondisclosure, confidentiality and other contractual restrictions to protect our proprietary technology. However, these may not adequately protect our rights or permit us to gain or keep any competitive advantage.
The issuance of a patent is not conclusive as to its scope, validity or enforceability. The scope, validity or enforceability of our issued patents can be challenged in litigation or proceedings before the U.S. Patent and Trademark Office, or the USPTO, or foreign patent offices. In addition, our pending patent applications include claims to numerous important aspects of our products under development that are not currently protected by any of our issued patents. We cannot assure you that any of our pending patent applications will result in the issuance of patents to us. The USPTO or foreign patent offices may deny or require significant narrowing of claims in our pending patent applications. Patents issued as a result of the pending patent applications, if any, may not provide us with significant commercial protection or be issued in a form that is advantageous to us. Proceedings before the USPTO or foreign patent offices could result in adverse decisions as to the priority of our inventions and the narrowing or invalidation of claims in issued patents. The laws of some foreign countries may not protect our intellectual property rights to the same extent as the laws of the United States, if at all.
Our competitors may successfully challenge and invalidate or render unenforceable our issued patents, including any patents that may issue in the future, which could prevent or limit our ability to market our products and could limit our ability to stop competitors from marketing products that are substantially equivalent to ours. In addition, competitors may be able to design around our patents or develop products that provide outcomes that are comparable to our products but that are not covered by our patents.
We have also entered into confidentiality and assignment of intellectual property agreements with all of our employees, consultants and advisors as one of the ways we seek to protect our intellectual property and other proprietary technology. However, these agreements may not be enforceable or may not provide meaningful protection for our trade secrets or other proprietary information in the event of unauthorized use or disclosure or other breaches of the agreements.
In the event a competitor infringes upon any of our patents or other intellectual property rights, enforcing our rights may be difficult, time consuming and expensive, and would divert management’s attention from managing our business. There can be no assurance that we will be successful on the merits in any enforcement effort. In addition, we may not have sufficient resources to litigate, enforce or defend our intellectual property rights.
We have no patent protection covering the composition of matter for our solid MC2 silicon nitride or the process we use for manufacturing our MC2 silicon nitride, and competitors may create silicon nitride formulations substantially similar to ours.
Although we have a number of U.S. and foreign patents and pending applications relating to our MC2 silicon nitride products or product candidates, we have no patent protection either for the composition of matter for our silicon nitride or for the processes of manufacturing MC2 silicon nitride. As a result, competitors may create silicon nitride formulations substantially similar to ours, and use their formulations in products that may compete with our silicon nitride products, provided they do not violate our issued product patents. Although we have, and will continue to develop, significant know-how related to these processes, there can be no assurance that we will be able to maintain this know-how as trade secrets, and competitors may develop or acquire equally valuable or more valuable know-how related to the manufacture of silicon nitride.
27
We could become subject to intellectual property litigation that could be costly, result in the diversion of management’s time and efforts, require us to pay damages, prevent us from marketing our commercially available products or product candidates and/or reduce the margins we may realize from our products that we may commercialize.
The medical devices industry is characterized by extensive litigation and administrative proceedings over patent and other intellectual property rights. Whether a product infringes a patent involves complex legal and factual issues, and the determination is often uncertain. There may be existing patents of which we are unaware that our products under development may inadvertently infringe. The likelihood that patent infringement claims may be brought against us increases as the number of participants in the orthopedic market increases and as we achieve more visibility in the market place and introduce products to market.
Any infringement claim against us, even if without merit, may cause us to incur substantial costs, and would place a significant strain on our financial resources, divert the attention of management from our core business, and harm our reputation. In some cases, litigation may be threatened or brought by a patent holding company or other adverse patent owner who has no relevant product revenues and against whom our patents may provide little or no deterrence. If we were found to infringe any patents, we could be required to pay substantial damages, including triple damages if an infringement is found to be willful, and royalties and could be prevented from selling our products unless we obtain a license or are able to redesign our products to avoid infringement. We may not be able to obtain a license enabling us to sell our products on reasonable terms, or at all, and there can be no assurance that we would be able to redesign our products in a way that would not infringe those patents. If we fail to obtain any required licenses or make any necessary changes to our technologies or the products that incorporate them, we may be unable to commercialize one or more of our products or may have to withdraw products from the market, all of which would have a material adverse effect on our business, financial condition and results of operations.
In addition, in order to further our product development efforts, we have entered into agreements with orthopedic surgeons to help us design and develop new products, and we expect to enter into similar agreements in the future. In certain instances, we have agreed to pay such surgeons royalties on sales of products which incorporate their product development contributions. There can be no assurance that surgeons with whom we have entered into such arrangements will not claim to be entitled to a royalty even if we do not believe that such products were developed by cooperative involvement between us and such surgeons. In addition, some of our surgeon advisors are employed by academic or medical institutions or have agreements with other orthopedic companies pursuant to which they have agreed to assign or are under an obligation to assign to those other companies or institutions their rights in inventions which they conceive or develop, or help conceive or develop.
There can be no assurance that one or more of these orthopedic companies or institutions will not claim ownership rights to an invention we develop in collaboration with our surgeon advisors or consultants on the basis that an agreement with such orthopedic company or institution gives it ownership rights in the invention or that our surgeon advisors on consultants otherwise have an obligation to assign such inventions to such company or institution. Any such claim against us, even without merit, may cause us to incur substantial costs, and would place a significant strain on our financial resources, divert the attention of management from our core business and harm our reputation.
We may be subject to damages resulting from claims that we, our employees, or our independent sales agencies have wrongfully used or disclosed alleged trade secrets of our competitors or are in breach of non-competition agreements with our competitors or non-solicitation agreements.
Many of our employees were previously employed at other orthopedic companies, including our competitors and potential competitors. Many of our distributors and potential distributors sell, or in the past have sold, products of our competitors. We may be subject to claims that either we, or these employees or distributors, have inadvertently or otherwise used or disclosed the trade secrets or other proprietary information of our competitors. In addition, we have been and may in the future be subject to claims that we caused an employee or sales agent to break the terms of his or her non-competition agreement or non-solicitation agreement. Litigation may be necessary to defend against these claims. Even if we are successful in defending against these claims, litigation could result in substantial costs and be a distraction to management. If we fail in defending such claims, in
28
addition to paying money damages, we may lose valuable intellectual property rights or personnel. A loss of key personnel or their work product could hamper or prevent our ability to commercialize products, which could have an adverse effect on our business, financial condition and results of operations.
If our silicon nitride products or our product candidates conflict with the rights of others, we may not be able to manufacture or market our products or product candidates, which could have a material and adverse effect on us.
Our commercial success will depend in part on not infringing the patents or violating the other proprietary rights of third parties. Issued patents held by others may limit our ability to develop commercial products. All issued patents are entitled to a presumption of validity under the laws of the United States. If we need suitable licenses to such patents to permit us to develop or market our product candidates, we may be required to pay significant fees or royalties and we cannot be certain that we would even be able to obtain such licenses. Competitors or third parties may obtain patents that may cover subject matter we use in developing the technology required to bring our products to market, that we use in producing our products, or that we use in treating patients with our products. We know that others have filed patent applications in various jurisdictions that relate to several areas in which we are developing products. Some of these patent applications have already resulted in patents and some are still pending. If we were found to infringe any of these issued patents or any of the pending patent applications, when and if issued, we may be required to alter our processes or product candidates, pay licensing fees or cease activities. If use of technology incorporated into or used to produce our product candidates is challenged, or if our processes or product candidates conflict with patent rights of others, third parties could bring legal actions against us, in Europe, the United States and elsewhere, claiming damages and seeking to enjoin manufacturing and marketing of the affected products. Additionally, it is not possible to predict with certainty what patent claims may issue from pending applications. In the United States, for example, patent prosecution can proceed in secret prior to issuance of a patent, provided such application is not filed in foreign jurisdiction. For U.S. patent applications that are also filed in foreign jurisdictions, such patent applications will not publish until 18 months from the filing date of the application. As a result, third parties may be able to obtain patents with claims relating to our product candidates which they could attempt to assert against us. Further, as we develop our products, third parties may assert that we infringe the patents currently held or licensed by them, and we cannot predict the outcome of any such action.
There has been extensive litigation in the medical devices industry over patents and other proprietary rights. If we become involved in any litigation, it could consume a substantial portion of our resources, regardless of the outcome of the litigation. If these legal actions are successful, in addition to any potential liability for damages, we could be required to obtain a license, grant cross-licenses and pay substantial royalties in order to continue to manufacture or market the affected products.
We cannot assure you that we would prevail in any legal action or that any license required under a third party patent would be made available on acceptable terms, or at all. Ultimately, we could be prevented from commercializing a product, or forced to cease some aspect of our business operations, as a result of claims of patent infringement or violation of other intellectual property rights, which could have a material and adverse effect on our business, financial condition and results of operations.
Risks Related to Potential Litigation from Operating Our Business
We may become subject to potential product liability claims, and we may be required to pay damages that exceed our insurance coverage.
Our business exposes us to potential product liability claims that are inherent in the design, testing, manufacture, sale and distribution of our currently marketed products and each of our product candidates that we are seeking to introduce to the market. The use of orthopedic medical devices can involve significant risks of serious complications, including bleeding, nerve injury, paralysis, infection, and even death. Any product liability claim brought against us, with or without merit, could result in the increase of our product liability insurance rates or in our inability to secure coverage in the future on commercially reasonable terms, if at all. In addition, if our product liability insurance proves to be inadequate to pay a damage award, we may have to pay the excess of this award out of our cash reserves, which could significantly harm our financial condition. If longer-term patient results and experience indicate that our products or any component of a product causes tissue
29
damage, motor impairment or other adverse effects, we could be subject to significant liability. A product liability claim, even one without merit, could harm our reputation in the industry, lead to significant legal fees, and result in the diversion of management’s attention from managing our business.
Any claims relating to our improper handling, storage or disposal of biological or hazardous materials could be time consuming and costly.
Although we do not believe that the manufacture of our silicon nitride or non-silicon nitride products will involve the use of hazardous materials, it is possible that regulatory authorities may disagree or that changes to our manufacturing processes may result in such use. Our business and facilities and those of our suppliers and future suppliers may therefore be subject to foreign, federal, state and local laws and regulations governing the use, manufacture, storage, handling and disposal of hazardous materials and waste products. We may incur significant expenses in the future relating to any failure to comply with environmental laws. Any such future expenses or liability could have a significant negative impact on our business, financial condition and results of operations.
Risks Related to Our GE Secured Lending Facility
If we do not adhere to the financial covenants set forth in our GE Secured Lending Facility, we will be in default of our GE Secured Lending Facility.
The GE Secured Lending Facility includes certain financial covenants including a requirement that the average time that it takes us to collect on any amounts due to us from any customers not exceed 85 days for any calendar month, as well as a liquidity covenant. We were in compliance with all of the financial covenants as of September 30, 2013, however, we have in the past not been in compliance. The liquidity covenant may significantly limit our ability to use our cash as cash equivalents to fund our operations as it requires us to maintain cash and cash equivalents and availability under the revolving credit facility equal to the greater of $1.5 million (exclusive of availability under the revolving credit facility) or six times our monthly cash burn, as defined in the facility. As of September 30, 2013, six times our monthly cash burn equaled $7.1 million. We were in default of this liquidity covenant in November 2013 and, in December 2013, we obtained a waiver of this liquidity covenant from November 1, 2013 through January 31, 2014 and agreed to increase the credit reserve under this facility from $0.5 million to $1.0 million. On January 28, 2014, we obtained an additional waiver of the liquidity covenant from GE Capital through February 28, 2014 and agreed to increase the credit reserve under this facility by an additional $0.5 million, bringing the total reserve to $1.5 million.
We may seek to refinance the GE Secured Lending Facility or obtain additional financing. However, we may have difficulty obtaining additional debt financing, due to the restrictions in the GE Secured Lending Facility and may have difficulty in refinancing the facility. There is no guarantee we will be successful in entering into any such lending arrangement on commercially reasonable terms, or at all. Moreover, even if we are able to enter into a new lending arrangement sufficient to repay the GE Secured Lending Facility, such new facility will likely contain liquidity, financial and operational covenants, which could be as restrictive or more restrictive than those in the GE Secured Lending Facility. In addition, even if we are successful in obtaining additional financing, the terms of such additional debt could further restrict our operating and financial flexibility. Further, if we are liquidated, the lenders’ right to repayment would be senior to the rights of the holders of our common stock to receive any proceeds from the liquidation. The agent could declare a default under the GE Secured Lending Facility upon the occurrence of a material adverse effect, as defined under the loan agreement, thereby requiring us to either repay the outstanding indebtedness immediately or attempt to reverse the declaration of default through negotiation or litigation. Any declaration by the agent of an event of default could significantly harm our business and prospects and could cause the price of our common shares to decline.
Risks Related to Our Common Stock and this Offering
There has been no prior public market for our common stock and an active trading market may not develop.
Prior to this offering, there has been no public market for our common stock. We cannot predict the extent to which investor interest in our company will lead to the development of an active trading market on The NASDAQ Capital Market or otherwise or how liquid that market might become. In addition, The NASDAQ Capital Market may be less liquid than The NASDAQ Global Market, on which we previously expected our
30
common stock to trade. The lack of an active market may impair the value of your shares and your ability to sell your shares at the time you wish to sell them. An inactive market may also impair our ability to raise capital by selling our common stock and may impair our ability to acquire other companies, products or technologies by using our common stock as consideration.
We expect that the price of our common stock will fluctuate substantially and you may not be able to sell your shares at or above the offering price.
You should consider an investment in our common stock risky and invest only if you can withstand a significant loss and wide fluctuations in the market value of your investment. The initial public offering price for the shares of our common stock sold in this offering will be determined by negotiation between us and the underwriters and will be based on several factors. This price may not reflect the market price of our common stock following this offering. You may be unable to sell your shares of common stock at or above the initial public offering price due to fluctuations in the market price of our common stock arising from changes in our operating performance or prospects. In addition, the volatility of orthopedic company stocks often does not correlate to the operating performance of the companies represented by such stocks. Some of the factors that may cause the market price of our common stock to fluctuate include:
| • | our ability to sell our current products and the cost of revenue; |
| • | our ability to develop, obtain regulatory clearances or approvals for, and market new and enhanced product candidates on a timely basis; |
| • | changes in governmental regulations or in the status of our regulatory approvals, clearances or future applications; |
| • | our announcements or our competitors’ announcements regarding new products, product enhancements, significant contracts, number and productivity of distributors, number of hospitals and surgeons using products, acquisitions or strategic investments; |
| • | announcements of technological or medical innovations for the treatment of orthopedic pathology; |
| • | delays or other problems with the manufacturing of our products, product candidates and related instrumentation; |
| • | volume and timing of orders for our products and our product candidates, if and when commercialized; |
| • | changes in the availability of third-party reimbursement in the United States and other countries; |
| • | quarterly variations in our or our competitors’ results of operations; |
| • | changes in earnings estimates or recommendations by securities analysts, if any, who cover our common stock; |
| • | failure to meet estimates or recommendations by securities analysts, if any, who cover our stock; |
| • | changes in the fair value of our common stock warrant liability resulting from changes in the market price of our common stock, which may result in significant fluctuations in our quarterly and annual operating results; |
| • | changes in healthcare policy in the United States and internationally; |
| • | product liability claims or other litigation involving us; |
| • | sales of large blocks of our common stock, including sales by our executive officers, directors and significant stockholders; |
| • | disputes or other developments with respect to intellectual property rights; |
| • | changes in accounting principles; |
| • | changes to tax policy; and |
| • | general market conditions and other factors, including factors unrelated to our operating performance or the operating performance of our competitors. |
These and other external factors may cause the market price and demand for our common stock to fluctuate substantially, which may limit or prevent investors from readily selling their shares of common stock and may otherwise negatively affect the liquidity of our common stock. In addition, in the past, when the market price of a stock has been volatile, holders of that stock have sometimes instituted securities class action litigation against the company that issued the stock. If our stockholders brought a lawsuit against us, we could incur substantial costs defending the lawsuit regardless of the merits of the case or the eventual outcome. Such a lawsuit also would divert the time and attention of our management.
31
Securities analysts may not initiate coverage of our common stock or may issue negative reports, which may have a negative impact on the market price of our common stock.
Securities analysts may elect not to provide research coverage of our common stock after the completion of this offering. If securities analysts do not cover our common stock after the completion of this offering, the lack of research coverage may cause the market price of our common stock to decline. The trading market for our common stock may be affected in part by the research and reports that industry or financial analysts publish about our business. If one or more of the analysts who elect to cover us downgrade our stock, our stock price would likely decline rapidly. If one or more of these analysts cease coverage of us, we could lose visibility in the market, which in turn could cause our stock price to decline. In addition, under the Sarbanes-Oxley Act of 2002, or the Sarbanes-Oxley Act, and a global settlement among the Securities and Exchange Commission, or the SEC, other regulatory agencies and a number of investment banks, which was reached in 2003, many investment banking firms are required to contract with independent financial analysts for their stock research. It may be difficult for a company such as ours, with a smaller market capitalization, to attract independent financial analysts that will cover our common stock. This could have a negative effect on the market price of our stock.
If our executive officers, directors and principal stockholders choose to act together, they will be able to exert significant influence over us and our significant corporate decisions and may act in a manner that advances their best interests and not necessarily those of other stockholders.
Upon completion of this offering, our executive officers, directors, and beneficial owners of 5% or more of our outstanding common stock and their affiliates will beneficially own approximately 24.0% of our outstanding common stock, or approximately 23.1% if the underwriters’ option to purchase additional shares is exercised in full. As a result, these persons, acting together, will have the ability to significantly influence the outcome of all matters requiring stockholder approval, including the election and removal of directors and any merger, consolidation, or sale of all or substantially all of our assets, and they may act in a manner that advances their best interests and not necessarily those of other stockholders, including investors in this offering, by among other things:
| • | delaying, deferring or preventing a change in control of us; |
| • | entrenching our management and/or our board of directors; |
| • | impeding a merger, consolidation, takeover or other business combination involving us; |
| • | discouraging a potential acquirer from making a tender offer or otherwise attempting to obtain control of us; or |
| • | causing us to enter into transactions or agreements that are not in the best interests of all stockholders. |
Future sales of our common stock in the public market after this offering may cause our stock price to decline and impair our ability to raise future capital through the sale of our equity securities.
Upon completion of this offering, our current stockholders will hold a substantial number of shares of our common stock that they will be able to sell in the public market in the near future. Sales by our current stockholders of a substantial number of shares after this offering could significantly reduce the market price of our common stock. Moreover, following the completion of this offering, the holders of 2,581,941 shares of common stock, assuming the conversion of our convertible preferred stock, and holders of warrants to purchase 72,939 shares of common stock, assuming the conversion of preferred stock warrants into common stock warrants, and holders of 12,363 shares of common stock, assuming the exercise of common stock warrants, will have rights, subject to some conditions, to require us to include their shares in registration statements that we may file for ourselves or other stockholders. These shares of common stock, totaling 2,667,243 shares, assuming the exercise of the common stock warrants, represent approximately 22.0% of the total number of shares of our common stock to be outstanding immediately after this offering, assuming conversion of the preferred stock warrants but no exercise of the underwriters’ option to purchase additional shares. Please see the “Description of Capital Stock—Registration Rights” section of this prospectus for a description of the registration rights of these stockholders. In addition, immediately upon completion of this offering, warrants to acquire approximately 633,669 shares of our common stock and 8,627,454 shares of our outstanding common stock then held by existing stockholders which are deemed to be “restricted securities” pursuant to Rule 144 under the Securities Act of 1933, as amended, or the Securities Act, will be eligible for sale in reliance on Rule 144, subject to the lock-up agreements covering substantially all of our securities as described in the “Underwriting” section of this
32
prospectus. Upon completion of this offering, a holder of warrants to acquire shares of our common stock will be able to net exercise such warrants by surrendering a portion of that holder’s warrants as payment of the exercise price rather than paying the exercise price in cash. As of September 30, 2013, holders of warrants to acquire approximately 633,669 shares of our common stock would be eligible to rely on Rule 144 for the resale of such shares if the warrants are net exercised, subject to the lock-up agreements described in the “Underwriting” section of this prospectus. Additionally, all of our outstanding RSUs will vest upon the expiration of the lock-up agreements, resulting in an additional 188,128 shares eligible to be sold in the public market.
Following the completion of this offering, we also intend to register all shares of our common stock that we may issue pursuant to the 2003 Plan and the Amended and Restated 2012 Equity Incentive Plan, or the 2012 Plan. Shares issued by us upon exercise of options granted under our stock plans would be eligible for sale in the public market upon the effective date of the registration statement for those shares, subject to the lock-up agreements described in the “Underwriting” section of this prospectus. If any of these holders cause a large number of securities to be sold in the public market, the sales could reduce the trading price of our common stock. These sales also could impede our ability to raise future capital. Please see the “Shares Eligible for Future Sale” section of this prospectus for a description of sales that may occur in the future.
Our management team may allocate the proceeds of this offering in ways in which you may not agree.
We intend to use the net proceeds from this offering to continue to increase market awareness of our silicon nitride spinal products, continue to implement our sales and marketing strategy, enhance our commercial infrastructure and commercialize our silicon nitride joint replacement components and other products. For a further description of our intended use of net proceeds of this offering, please see the “Use of Proceeds” section of this prospectus.
Because of the number and variability of factors that will determine our use of the net proceeds from this offering, our ultimate use of these proceeds may vary substantially from their currently intended use. Our management will have considerable discretion over the use of the net proceeds of this offering. Stockholders may not agree with such uses, and our use of the net proceeds may be used in a manner that does not increase our operating results or market value.
Anti-takeover provisions in our organizational documents and Delaware law may discourage or prevent a change in control, even if an acquisition would be beneficial to our stockholders, which could affect our stock price adversely and prevent attempts by our stockholders to replace or remove our current management.
Our restated certificate of incorporation and restated bylaws that will be in effect upon the completion of this offering contain provisions that could discourage, delay or prevent a merger, acquisition or other change in control of our company or changes in our board of directors that our stockholders might consider favorable, including transactions in which you might receive a premium for your shares. These provisions also could limit the price that investors might be willing to pay in the future for shares of our common stock, thereby depressing the market price of our common stock. Stockholders who wish to participate in these transactions may not have the opportunity to do so. Furthermore, these provisions could prevent or frustrate attempts by our stockholders to replace or remove management. These provisions:
| • | allow the authorized number of directors to be changed only by resolution of our board of directors; |
| • | provide for a classified board of directors, such that not all members of our board will be elected at one time; |
| • | prohibit our stockholders from filling board vacancies, limit who may call stockholder meetings, and prohibit the taking of stockholder action by written consent; |
| • | prohibit our stockholders from making certain changes to our restated certificate of incorporation or restated bylaws except with the approval of holders of 75% of the outstanding shares of our capital stock entitled to vote; |
| • | require advance written notice of stockholder proposals that can be acted upon at stockholders meetings and of director nominations to our board of directors; and |
| • | authorize our board of directors to create and issue, without prior stockholder approval, preferred stock that may have rights senior to those of our common stock and that, if issued, could operate as a “poison pill” to dilute the stock ownership of a potential hostile acquirer to prevent an acquisition that is not approved by our board of directors. |
33
In addition, we are subject to the provisions of Section 203 of the Delaware General Corporation Law, which may prohibit certain business combinations with stockholders owning 15% or more of our outstanding voting stock. Any delay or prevention of a change in control transaction or changes in our board of directors could cause the market price of our common stock to decline.
Investors in this offering will pay a much higher price than the book value of our common stock and, therefore, you will incur immediate and substantial dilution of your investment.
If you purchase common stock in this offering, you will incur immediate and substantial dilution of $4.80 per share, representing the difference between the initial public offering price per share of our common stock and our pro forma net tangible book value per share after giving effect to this offering based on the initial public offering price of $5.75 per share. In the past, we have also issued RSUs that will vest in the future and options and warrants to acquire common stock at prices significantly below the initial public offering price. To the extent these outstanding RSUs vest and these outstanding options and warrants are ultimately exercised, you will sustain further dilution. For a further description of the dilution you will incur in this offering, see the “Dilution” section of this prospectus.
We do not intend to pay cash dividends.
We have never declared or paid cash dividends on our capital stock and we do not anticipate paying any cash dividends in the foreseeable future. We currently intend to retain all available funds and any future earnings for debt service and use in the operation and expansion of our business. The GE Secured Lending Facility also contains a negative covenant which prohibits us from paying dividends to our stockholders without the prior written consent of the lenders. In addition, the terms of any future debt or credit facility may preclude us from paying any dividends.
Risks Related to Public Companies
We are an “emerging growth company” as defined in the Jumpstart Our Business Startups Act of 2012 and the reduced disclosure requirements applicable to emerging growth companies may make our common stock less attractive to investors.
We are an “emerging growth company,” as defined in the Jumpstart Our Business Startups Act of 2012, or the JOBS Act. For as long as we continue to be an emerging growth company, we may take advantage of exemptions from various reporting requirements that are applicable to other public companies that are not emerging growth companies, including (1) not being required to comply with the auditor attestation requirements of Section 404 of the Sarbanes-Oxley Act, (2) reduced disclosure obligations regarding executive compensation in this prospectus and our periodic reports and proxy statements and (3) exemptions from the requirements of holding a nonbinding advisory vote on executive compensation and stockholder approval of any golden parachute payments not previously approved. In addition, as an emerging growth company, we have only included two years, rather than the customary three, of audited financial statements and two years, rather than the customary five, of selected financial data in this prospectus. Additionally, under the JOBS Act, emerging growth companies can also delay adopting new or revised accounting standards until such time as those standards apply to private companies. We are electing to delay such adoption of new or revised accounting standards on the relevant dates on which adoption of such standards is required for non-emerging growth companies. As a result of this election, our financial statements may not be comparable to the financial statements of other public companies.
We may take advantage of these exemptions until we are no longer an emerging growth company. Under the JOBS Act, we may be able to maintain emerging growth company status for up to five years, although circumstances could cause us to lose that status earlier, including if the market value of our common stock held by non-affiliates exceeds $700 million as of any June 30 before the end of such five-year period or if we have total annual gross revenue of $1.0 billion or more during any fiscal year before that time, in which cases we would no longer be an emerging growth company as of the following December 31. Additionally, if we issue more than $1.0 billion in non-convertible debt during any three-year period before that time, we would cease to
34
be an emerging growth company immediately. Even after we no longer qualify as an emerging growth company, we may still qualify as a “smaller reporting company,” which would allow us to take advantage of many of the same exemptions from disclosure requirements, including not being required to comply with the auditor attestation requirements of Section 404 of the Sarbanes-Oxley Act and reduced disclosure obligations regarding executive compensation in our periodic reports and proxy statements. We cannot predict whether investors will find our common stock less attractive because of our reliance on any of these exemptions. If some investors find our common stock less attractive as a result, there may be a less active trading market for our common stock and our stock price may be more volatile.
We will incur increased costs as a result of being a public company and our management expects to devote substantial time to public company compliance programs.
As a public company, we will incur significant legal, insurance, accounting and other expenses that we did not incur as a private company. In addition, our administrative staff will be required to perform additional tasks. For example, in anticipation of becoming a public company, we will need to adopt additional internal controls and disclosure controls and procedures, broaden the scope of services provided to us by our transfer agent, adopt an insider trading policy and bear all of the internal and external costs of preparing and distributing periodic public reports in compliance with our obligations under the securities laws. We intend to invest resources to comply with evolving laws, regulations and standards, and this investment will result in increased general and administrative expenses and may divert management’s time and attention from product development and commercialization activities. If our efforts to comply with new laws, regulations and standards differ from the activities intended by regulatory or governing bodies due to ambiguities related to practice, regulatory authorities may initiate legal proceedings against us, and our business may be harmed. In addition, if we are unable to continue to meet these requirements, we may not be able to maintain the listing of our common stock on The NASDAQ Capital Market, which would likely have a material adverse effect on the trading price of our common stock.
In connection with this offering, we are increasing our directors’ and officers’ insurance coverage, which will increase our insurance cost. In the future, it will be more expensive for us to obtain director and officer liability insurance, and we may be required to accept reduced coverage or incur substantially higher costs to obtain coverage. These factors could also make it more difficult for us to attract and retain qualified executive officers and qualified members of our board of directors, particularly to serve on our audit and compensation committees.
Our internal control over financial reporting does not currently meet the standards required by Section 404 of the Sarbanes-Oxley Act, and failure to achieve and maintain effective internal control over financial reporting in accordance with Section 404 of the Sarbanes-Oxley Act could result in material misstatements of our annual or interim financial statements and have a material adverse effect on our business and share price.
We are not currently required to comply with the SEC’s rules that implement Section 404 of the Sarbanes-Oxley Act, and are therefore not yet required to make a formal assessment of the effectiveness of our internal control over financial reporting for that purpose. Upon becoming a public company, we will however be required to comply with certain of these rules, which will require management to certify financial and other information in our quarterly and annual reports and provide an annual management report on the effectiveness of our internal control over financial reporting commencing with our second annual report. This assessment will need to include the disclosure of any material weaknesses or significant deficiencies in our internal control over financial reporting identified by our management or our independent registered public accounting firm. A “material weakness” is a deficiency, or a combination of deficiencies, in internal control over financial reporting such that there is a reasonable possibility that a material misstatement of our annual or interim financial statements will not be prevented or detected on a timely basis. A “significant deficiency” is a deficiency, or a combination of deficiencies, in internal control over financial reporting that is less severe than a material weakness, yet important enough to merit attention by those responsible for oversight of our financial reporting, including the audit committee of the board of directors.
Our independent registered public accounting firm will not be required to formally attest to the effectiveness of our internal control over financial reporting until the later of our second annual report or the first annual report
35
required to be filed with the Commission following the date we are no longer an “emerging growth company” as defined in the JOBS Act. However, in connection with our audit for the year ended December 31, 2012 and their review of our interim financial statements, our independent registered public accounting firm noted four material weaknesses and one significant deficiency in our internal control over financial reporting.
One material weakness related to our improper recording and disclosure of non-routine transactions due to deficiencies in the design and operation of our controls to account for non-routine transactions as part of the financial close process. We plan to remedy this by increasing the size and expertise of our internal accounting team.
Another material weakness was identified related to the deficiency in the design and operation of our controls to account for inventory. In addition to increasing the size and expertise of our accounting team, we plan to address this deficiency by physically counting inventory held by certain of our distributors on a more frequent basis and monitoring more closely the movement of inventory between locations.
The third material weakness related to deficiencies in our income tax accounting. We intend to implement a formal process for accounting for income taxes, including evaluating the tax treatment of certain transactions on permanent and temporary book/tax differences, and the effect on the income tax provision and related deferred tax accounting balances.
The fourth material weakness relates to deficiencies in the design and operation of our controls to appropriately identify and evaluate transactions for appropriate cut-off at the end of the financial reporting period and the level of precision and timeliness of our financial close process. We plan to remedy this by implementing a formal financial close process related to financial reporting.
Additionally, our independent registered public accounting firm identified a significant deficiency related to the design and operation of our controls to manage the safeguarding of assets, particularly our instruments that we provide to surgeons and hospitals on consignment. We plan to implement a formal process for tracking and monitoring fixed assets as they are deployed for use at various locations.
We cannot assure you that our plans will sufficiently address the identified deficiencies, nor can we assure you that there will not be material weaknesses or significant deficiencies in our internal controls in the future. Additionally, in the event that our internal control over financial reporting is perceived as inadequate, or that we are unable to produce timely or accurate financial statements, investors may lose confidence in our operating results and the trading price of our common stock could decline.
Finally, as a private company, we have not previously been required to prepare quarterly financial statements, nor have we been required to generate financial statements in the time periods mandated for public companies by the Commission’s reporting requirements. We believe that we will need to expand our accounting resources, including the size and expertise of our internal accounting team, to effectively execute a quarterly close process and on an appropriate time frame for a public company. If we are unsuccessful or unable to sufficiently expand these resources, we may not be able to produce U.S. GAAP-compliant financial statements on a time frame required to comply with our reporting requirements under the Exchange Act, and the financial statements we produce may contain material misstatements, either of which could cause investors to lose confidence in our financial reports and our financial reporting generally, which could lead to a material decline in the trading price of our common stock.
36
SPECIAL NOTE REGARDING FORWARD-LOOKING STATEMENTS
This prospectus contains forward-looking statements that are based on our management’s beliefs and assumptions and on information currently available to us. The forward-looking statements are contained principally in, but not limited to, the sections entitled “Prospectus Summary,” “Risk Factors,” “Management’s Discussion and Analysis of Financial Condition and Results of Operations” and “Business.” These statements relate to future events or to our future financial performance and involve known and unknown risks, uncertainties, and other factors that may cause our or our industry’s actual results, levels of activity, performance or achievements to be materially different from any future results, levels of activity, performance or achievements expressed or implied by these forward-looking statements. Forward-looking statements include, but are not limited to, statements about:
| • | our ability to achieve sufficient market acceptance of any of our products or product candidates; |
| • | our perception of the growth in the size of the potential market for our products and product candidates; |
| • | our estimate of the advantages of our silicon nitride technology platform; |
| • | our ability to become a profitable biomaterial technology company; |
| • | our ability to satisfy or receive waivers from compliance with the covenants made in the GE Secured Lending Facility; |
| • | our ability to succeed in obtaining FDA clearance or approvals for our product candidates; |
| • | our ability to receive CE Marks for our product candidates; |
| • | the timing, costs and other limitations involved in obtaining regulatory clearance or approval for any of our product candidates and product candidates and, thereafter, continued compliance with governmental regulation of our existing products and activities; |
| • | our ability to protect our intellectual property and operate our business without infringing upon the intellectual property rights of others; |
| • | our ability to obtain sufficient quantities and satisfactory quality of raw materials to meet our manufacturing needs; |
| • | the availability of adequate coverage reimbursement from third-party payors in the United States; |
| • | our estimates regarding anticipated operating losses, future product revenue, expenses, capital requirements and liquidity; |
| • | our ability to refinance the GE Secured Lending Facility; |
| • | our estimates regarding our needs for additional financing and our ability to obtain such additional financing on suitable terms; |
| • | our ability to maintain and continue to develop our sales and marketing infrastructure; |
| • | our ability to enter into and maintain suitable arrangements with an adequate number of distributors; |
| • | our manufacturing capacity to meet future demand; |
| • | our ability to establish a secondary manufacturing source for our silicon nitride products; |
| • | our ability to develop effective and cost efficient manufacturing processes for our products; |
| • | our reliance on third parties to supply us with raw materials and our non-silicon nitride products and instruments; |
| • | the safety and efficacy of products and product candidates; |
| • | the timing of and our ability to conduct clinical trials; |
| • | the use of the proceeds of this offering; |
| • | potential changes to the healthcare delivery systems and payment methods in the United States or internationally; |
| • | any potential requirement by regulatory agencies that we restructure our relationships with referring surgeons; |
| • | our ability to develop and maintain relationships with surgeons, hospitals and marketers of our products; and |
| • | our ability to attract and retain a qualified management team, engineering team, sales and marketing team, distribution team, design surgeons, surgeon advisors and other qualified personnel and advisors. |
37
In some cases, you can identify forward-looking statements by terms such as “may,” “could,” “will,” “should,” “would,” “expect,” “plan,” “intend,” “anticipate,” “believe,” “estimate,” “predict,” “potential,” “project” or “continue” or the negative of these terms or other comparable terminology. These statements are only predictions. You should not place undue reliance on forward-looking statements because they involve known and unknown risks, uncertainties and other factors, which are, in some cases, beyond our control and which could materially affect results. Factors that may cause actual results to differ materially from current expectations include, among other things, those listed under the heading “Risk Factors” and elsewhere in this prospectus. If one or more of these risks or uncertainties occur, or if our underlying assumptions prove to be incorrect, actual events or results may vary significantly from those implied or projected by the forward-looking statements.
Any forward-looking statement in this prospectus reflects our current views with respect to future events and is subject to these and other risks, uncertainties and assumptions relating to our operations, results of operations, industry and future growth. Except as required by law, we assume no obligation to publicly update or revise any forward-looking statements contained in this prospectus, whether as a result of new information, future events or otherwise. The Private Securities Litigation Reform Act of 1995 and Section 27A of the Securities Act of 1933, as amended, or the Securities Act, do not protect any forward-looking statements that we make in connection with this offering.
38
We estimate that we will receive approximately $14.5 million in net proceeds from the sale of 3,500,000 shares of common stock in this offering, or approximately $17.3 million if the underwriters exercise their option to purchase additional shares in full, based upon the initial public offering price of $5.75 per share and after deducting underwriting discounts and commissions and estimated offering expenses payable by us.
The primary purposes of this offering are to create a public market for our common stock and thereby enable future access to the public equity markets by us and our stockholders and to obtain additional capital. We currently intend to use the net proceeds received by us from this offering in the following manner:
| • | up to $8.7 million to primarily support debt service under our existing senior secured credit facility with General Electric Capital Corporation, or GE Capital, as agent and lender, and Zions First National Bank, as lender, which we refer to as the GE Secured Lending Facility, as well as to support working capital needs and other general corporate purposes; |
| • | up to $4.0 million to fund research and development and commercialization activities of our product candidates, including the funding of clinical trials we plan to conduct for our product candidates; and |
| • | up to $1.8 million to continue to build sales, marketing and distribution capabilities for our silicon nitride technology platform, including the costs of inventory and instruments. |
The GE Secured Lending Facility consists of an $18.0 million term loan and up to a $3.5 million revolving credit facility with General Electric Capital Corporation, or GE Capital, as agent and lender, and Zions First National Bank, as lender. As of September 30, 2013, the total outstanding principal and accrued interest under the GE Secured Lending Facility was $18.0 million although the financial statements reflect a carrying value of $17.9 million due to the bifurcated value of warrants issued in connection with the debt. The term loan due in 2016 consisted of interest only payments until January 1, 2014. Beginning in January 2014, interest payments as well as monthly principal payments of approximately $600,000 each are required for a period of 30 months with an additional $720,000 repayment fee due upon prepayment in full or upon scheduled maturity and bears an interest rate of 7.5% annually. We amended the terms of our term loan and credit facility in December 2013 and agreed to pay the lenders a fee of $860,000 in connection with the execution of this amendment payable no later than March 1, 2014, provided that the fee is reduced to $645,000 if we repay all obligations under this facility on or before February 28, 2014. We further amended the terms of our term loan and credit facility on January 28, 2014 and agreed to pay the lenders a fee of $200,000 on March 31, 2014, if the facility is not repaid on or before March 31, 2014. This fee is in addition to the fee required in connection with the prior amendment. The revolving note due in 2016 bears an interest rate of 5.5% plus the higher of (i) 1.5% and (ii) the three-month LIBOR, determined as of two London business days divided by a number equal to 1.0 minus the aggregate of the rates of reserve requirements on the day that is two London business days prior to the beginning of the interest period for Eurocurrency funding that are required to be maintained by a member bank of the Federal Reserve System which resulted in an interest rate of 7.0% at September 30, 2013. See “Management’s Discussion and Analysis of Financial Condition and Results of Operations—Liquidity and Capital Resources—Indebtedness” for a further description of these financing arrangements.
We cannot specify with certainty all of the particular uses for the net proceeds to be received upon the completion of the offering. The amount and timing of our actual expenditures may vary significantly depending upon numerous factors, including the ultimate resolution of our FDA submissions for clearances or approvals of our product candidates, the specific clinical trial requirements imposed for market approval of our product candidates, our revenues, operating costs and capital expenditures. and other factors described under “Risk Factors.” We may find it necessary or advisable to use the net proceeds for other purposes, and our management will retain broad discretion in the allocation of the net proceeds from this offering.
Pending use of our net proceeds from this offering, we plan to invest the proceeds in a variety of capital preservation investments, including investment-grade, interest-bearing instruments. We cannot predict whether the net proceeds will yield a favorable return.
39
We have never paid or declared any cash dividends on our common stock, and we do not anticipate paying any cash dividends on our common stock in the foreseeable future. We intend to retain all available funds and any future earnings to fund the development and expansion of our business. In addition, the credit facility we intend to repay with the net proceeds of the offering prohibits us from paying cash dividends on our common stock. Additionally, in connection with the GE Secured Lending Facility, we issued certain warrants to the lenders which are further described under “Management’s Discussion and Analysis of Financial Condition and Results of Operations—Liquidity and Capital Resources.” Pursuant to the terms of the warrants, if we issue dividends to our stockholders which are payable in shares of our preferred stock, we will be required to lower the exercise price of the warrants or pay a proportionate share of any dividend distribution to the warrant holders upon exercise.
40
The table below reflects our unaudited capitalization as of September 30, 2013:
| • | on an actual basis; |
| • | on a pro forma basis giving effect to (a) the automatic conversion of all outstanding shares of our convertible preferred stock into an aggregate of 8,029,779 shares of our common stock upon the completion of this offering, and (b) the conversion of all outstanding warrants exercisable for shares of our convertible preferred stock into warrants exercisable for a total of 159,834 shares of common stock (but not assuming the exercise of these common stock warrants), upon completion of this offering and the related reclassification of the preferred stock warrant liability to additional paid in capital; and |
| • | on a pro forma basis, as adjusted to give effect to the sale of 3,500,000 shares of common stock in this offering at the initial public offering price, after deducting underwriting discounts and commissions and estimated offering expenses. |
You should read this table together with “Selected Consolidated Financial Data,” “Management’s Discussion and Analysis of Financial Condition and Results of Operations” and our financial statements and the related notes appearing elsewhere in this prospectus.
| As of September 30, 2013 | ||||||||||||
| (unaudited) (in thousands, except share and per share data) |
||||||||||||
| Actual | Pro Forma | Pro Forma as Adjusted |
||||||||||
| Debt |
$ | 17,917 | $ | 17,917 | $ | 17,917 | ||||||
| Common stock warrant liability |
3,877 | 3,877 | 3,877 | |||||||||
| Preferred stock warrant liability |
452 | — | — | |||||||||
| Convertible preferred stock (consisting of Series A and A-1, Series B and B-1, Series C and C-1, Series D and D-1, Series E and Series F convertible preferred stock on an aggregated basis), $0.01 par value; 100,000,000 shares authorized; 80,910,394 shares issued and outstanding actual, and no shares issued and outstanding, pro forma and pro forma as adjusted |
161,456 | — | — | |||||||||
| Stockholders’ equity (deficit): |
||||||||||||
| Common stock, $0.01 par value; 150,000,000 shares authorized; 597,675 shares issued and outstanding actual, 8,627,454 shares issued and outstanding pro forma; 12,127,454 shares issued and outstanding pro forma as adjusted |
6 | 86 | 121 | |||||||||
| Additional paid-in-capital |
(13,317 | ) | 148,511 | 162,947 | ||||||||
| Accumulated deficit |
(140,585 | ) | (140,585 | ) | (140,585 | ) | ||||||
|
|
|
|
|
|
|
|||||||
| Total stockholders’ equity (deficit) |
(153,896 | ) | 8,012 | 22,483 | ||||||||
|
|
|
|
|
|
|
|||||||
| Total capitalization(1) |
$ | 29,806 | $ | 29,806 | $ | 44,277 | ||||||
|
|
|
|
|
|
|
|||||||
| (1) | As of September 30, 2013, our cash, cash equivalents and restricted cash on an actual basis, pro forma basis and pro forma as adjusted basis were $7.9 million, $7.9 million and $22.3 million, respectively. Cash and cash equivalents are indications of liquidity and do not constitute capitalization. Restricted cash consists of cash we receive from payments of our accounts receivables held in a segregated account that must be applied to pay amounts owed under our revolving credit facility. |
The table above excludes the following as of September 30, 2013:
| • | 93,220 shares of common stock issuable upon the exercise of outstanding options to purchase common stock as of September 30, 2013 under the 2003 Plan, at a weighted-average exercise price of $29.38 per share; |
41
| • | 159,834 shares of common stock issuable upon the exercise of outstanding warrants for shares of Series C, Series D, Series E and Series F convertible preferred stock, on an as converted basis as of September 30, 2013, at a weighted average exercise price of $59.28 per share; |
| • | 473,835 shares of common stock issuable upon the exercise of warrants for shares of our common stock outstanding as of September 30, 2013, at a weighted-average exercise price of $28.09 per share; |
| • | 188,128 shares of common stock issuable upon the vesting of outstanding RSUs as of January 15, 2014 issued under the 2012 Plan; |
| • | 13,189 shares of common stock issuable upon the exercise of existing options to purchase common stock as of January 15, 2014 under the 2012 Plan at an exercise price of $17.53 per share; |
| • | 1,405,902 shares of our common stock issuable upon the vesting of RSUs to be issued under our 2012 Plan in connection with this offering; and |
| • | 1,392,781 additional shares of common stock reserved for issuance under the 2012 Plan, which reflects a November 2013 amendment and January 2014 amendments to the 2012 Plan, subject to the completion of this offering. |
42
CONVERSION OF CONVERTIBLE PREFERRED STOCK
Pursuant to the terms of our restated certificate of incorporation, as it will be amended prior to the completion of this offering, if the gross proceeds of this offering are greater than $20 million, the outstanding shares of each series of our convertible preferred stock will automatically convert into a number of shares of our common stock in connection with this offering based on a ratio determined by dividing the original issue price of such series of convertible preferred stock by the applicable conversion price of such series of convertible preferred stock. The following table sets forth the original issue price per share, the current conversion price and the current conversion ratio of each series of our convertible preferred stock:
| Series of Convertible Preferred Stock |
Original Issue Price Per Share ($) |
Conversion Price ($) |
Conversion Ratio |
|||||||||
| Series A |
0.60 | 0.6000 | 0.0388 | |||||||||
| Series A-1 |
0.60 | 0.4000 | 0.0582 | |||||||||
| Series B |
1.20 | 1.1259 | 0.0414 | |||||||||
| Series B-1 |
1.20 | 0.7872 | 0.0591 | |||||||||
| Series C |
2.00 | 1.7848 | 0.0435 | |||||||||
| Series C-1 |
2.00 | 1.2289 | 0.0631 | |||||||||
| Series D |
3.00 | 2.3052 | 0.0505 | |||||||||
| Series D-1 |
3.00 | 1.7821 | 0.0653 | |||||||||
| Series E |
2.00 | 1.7601 | 0.0441 | |||||||||
| Series F(1) |
2.00 | 2.0000 | 0.2500 | |||||||||
| (1) | The conversion ratio of our Series F convertible preferred stock is determined by dividing (a) the original issue price of the Series F convertible preferred stock of $2.00 by (b) 80% of the initial public offering price. On February 11, 2014, the holders of a majority of the outstanding shares of Series F convertible preferred stock agreed to waive the conversion adjustment under the restated certificate of incorporation such that in no event will the denominator used to calculate the conversion ratio be less than $8.00, provided that we complete our initial public offering on or before June 30, 2014. |
The outstanding shares of our convertible preferred stock will convert into 8,029,779 shares of common stock in connection with this offering and there will be 8,627,454 total shares of common stock outstanding before this offering.
43
If you invest in our common stock, your ownership interest will be diluted to the extent of the difference between the initial public offering price per share of our common stock and the pro forma net tangible book value per share of our common stock after this offering. We calculate net tangible book value per share by dividing the net tangible book value, or tangible assets less total liabilities and preferred shares, by the number of outstanding shares of common stock.
Our historical net tangible book deficit as of September 30, 2013 was $(164.9) million or $(275.86) per share of common stock. Our pro forma net tangible book deficit at September 30, 2013 was $(3.0) million, or $(0.34) per share, based on 8,627,454 shares of our common stock outstanding after giving effect to the conversion of all outstanding shares of our preferred stock into 8,029,779 shares of common stock.
After giving effect to the sale of 3,500,000 shares of common stock by us at the initial public offering price of $5.75 per share, less the underwriting discounts and commissions and our estimated offering expenses, our pro forma as adjusted net tangible book value at September 30, 2013 would be $11.5 million, or $0.95 per share. This amount represents an immediate increase in the pro forma net tangible book value of $1.29 per share to existing stockholders and an immediate dilution of $4.80 per share to new investors purchasing shares in this offering. The following table illustrates this dilution on a per share basis:
| Initial public offering price per share |
$ | 5.75 | ||||||
| Actual net tangible book deficit per share as of September 30, 2013 |
$ | (275.86 | ) | |||||
| Pro forma increase per share attributable to conversion of preferred stock to common stock and preferred stock warrants to common stock warrants and the related reclassification of the preferred stock warrant liability to additional paid in capital |
275.52 | |||||||
|
|
|
|||||||
| Pro forma net tangible book deficit per share as of September 30, 2013, before this offering |
(0.34 | ) | ||||||
| Increase in pro forma net tangible book value per share attributable to new investors |
1.29 | |||||||
|
|
|
|||||||
| Pro forma as adjusted net tangible book value per share after this offering |
0.95 | |||||||
|
|
|
|||||||
| Dilution in pro forma net tangible book value per share to new investors |
$ | 4.80 | ||||||
|
|
|
If the underwriters exercise in full their option to purchase 525,000 additional shares of our common stock in this offering, the pro forma as adjusted net tangible book value per share after the offering would be $1.13 per share, the increase in the pro forma net tangible book value per share to existing stockholders would be $0.18 per share and the dilution to new investors purchasing common stock in this offering would be $4.62 per share.
The following table shows on an adjusted pro forma basis at September 30, 2013, after giving effect to the automatic conversion of all outstanding shares of our convertible preferred stock into an aggregate of 8,029,779 shares of common stock upon the closing of this offering, the difference between the number of shares of common stock purchased from us, the total consideration paid to us and the average price paid per share by existing stockholders and by new public investors purchasing common stock in this offering based on the initial offering price of $5.75:
| Shares Purchased | Total Consideration | Average Price Per Share |
||||||||||||||||||
| Number | Percent | Amount | Percent | |||||||||||||||||
| (in thousands except per share data) | ||||||||||||||||||||
| Existing stockholders |
8,628 | 71 | % | $ | 152,879 | 88 | % | $ | 17.72 | |||||||||||
| New investors participating in this offering |
3,500 | 29 | % | 20,125 | 12 | % | $ | 5.75 | ||||||||||||
|
|
|
|
|
|
|
|
|
|||||||||||||
| Total |
12,128 | 100 | % | $ | 173,004 | 100 | % | $ | 14.27 | |||||||||||
|
|
|
|
|
|
|
|
|
|||||||||||||
44
If the underwriters exercise in full their option to purchase additional shares, sales by us in this offering will reduce the percentage of shares held by existing stockholders to 68% and will increase the number of shares held by new investors to 4,025,000, or 32%.
This information is based on 597,675 shares of common stock outstanding as of September 30, 2013, and assumes the conversion of all of our shares of convertible preferred stock outstanding as of September 30, 2013 into 8,029,779 shares of common stock upon the completion of this offering and excludes:
| • | 93,220 shares of common stock issuable upon the exercise of outstanding options to purchase common stock as of September 30, 2013, under the 2003 Plan, at a weighted-average exercise price of $29.38 per share; |
| • | 159,834 shares of common stock issuable upon the exercise of warrants for shares of Series C, Series D, Series E and Series F convertible preferred stock, on an as converted basis as of September 30, 2013 at a weighted average exercise price of $59.28 per share; |
| • | 473,835 shares of common stock issuable upon the exercise of warrants for shares of our common stock, outstanding as of September 30, 2013, at a weighted-average exercise price of $28.09 per share; |
| • | 188,128 shares of common stock issuable upon the vesting of outstanding RSUs as of January 15, 2014 issued under the 2012 Plan; |
| • | 13,189 shares of common stock issuable upon the exercise of existing options to purchase common stock as of January 15, 2014 under the 2012 Plan at an exercise price of $17.53 per share; |
| • | 1,405,902 shares of our common stock issuable upon the vesting of RSUs to be issued under our 2012 Plan in connection with this offering; and |
| • | 1,392,781 additional shares of common stock reserved for issuance under the 2012 Plan, which reflects a November 2013 amendment and January 2014 amendments to the 2012 Plan, subject to the completion of this offering. |
To the extent these outstanding options or warrants are exercised, or the RSUs vest, there will be further dilution to the new investors.
Furthermore, we may need to obtain additional capital which may be through the sale of equity or convertible debt securities to fund our current and future operating plans. To the extent we issue additional shares of common stock or other equity or convertible debt securities in the future, there will be further dilution to investors participating in this offering.
If all our outstanding options and warrants noted above had been exercised and the RSUs vested, the pro forma net tangible book value as of September 30, 2013 would have been $22.8 million, or $2.08 per share, and the as adjusted pro forma net tangible book value after this offering would have been $37.3 million, or $2.58 per share, causing dilution to new investors of $3.17 per share. Additionally, assuming all outstanding options and warrants noted above had been exercised and all outstanding RSUs noted above had vested, the difference between the number of shares of common stock purchased from us, the total consideration paid to us, and the average price paid per share by existing stockholders and by new investors purchasing common stock in this offering would be as follows:
| Shares Purchased | Total Consideration | Average Price Per Share |
||||||||||||||||||
| Number | Percent | Amount | Percent | |||||||||||||||||
| (in thousands except per share data) | ||||||||||||||||||||
| Existing stockholders |
10,962 | 76 | % | $ | 178,625 | 90 | % | $ | 16.30 | |||||||||||
| New investors participating in this offering |
3,500 | 24 | % | 20,125 | 10 | % | $ | 5.75 | ||||||||||||
|
|
|
|
|
|
|
|
|
|||||||||||||
| Total |
14,462 | 100 | % | $ | 198,750 | 100 | % | $ | 13.74 | |||||||||||
|
|
|
|
|
|
|
|
|
|||||||||||||
45
SELECTED CONSOLIDATED FINANCIAL DATA
The following selected consolidated financial data should be read in conjunction with “Management’s Discussion and Analysis of Financial Condition and Results of Operations” and our consolidated financial statements and the related notes included elsewhere in this prospectus. The selected consolidated statement of comprehensive loss data for the years ended December 31, 2011 and 2012 and selected consolidated balance sheet data as of December 31, 2011 and 2012 were derived from our audited consolidated financial statements that are included elsewhere in this prospectus. The selected consolidated statement of comprehensive loss data for the nine months ended September 30, 2012 and 2013 and selected consolidated balance sheet data as of September 30, 2013 were derived from our unaudited consolidated financial statements that are included elsewhere in this prospectus. In the opinion of management, the unaudited consolidated financial statements were prepared on a basis consistent with our audited consolidated financial statements contained in this prospectus and include all adjustments necessary for the fair presentation of the financial information contained in those statements. The historical results presented below are not necessarily indicative of financial results to be achieved in future periods, and the results for the nine months ended September 30, 2013 are not necessarily indicative of results to be expected for the full year.
| Years Ended December 31, |
Nine Months Ended September 30, |
|||||||||||||||
| 2011 | 2012 | 2012 | 2013 | |||||||||||||
| (unaudited) | ||||||||||||||||
| (in thousands, except per share amounts) | ||||||||||||||||
| Consolidated Statement of Comprehensive Loss Data: |
||||||||||||||||
| Product revenue |
$ | 20,261 | $ | 23,065 | $ | 17,126 | $ | 16,604 | ||||||||
| Cost of revenue |
||||||||||||||||
| Product revenue |
4,088 | 5,423 | 3,363 | 4,235 | ||||||||||||
| Write-down of excess and obsolete inventory |
— | 1,043 | — | 778 | ||||||||||||
|
|
|
|
|
|
|
|
|
|||||||||
| Total cost of revenue |
4,088 | 6,466 | 3,363 | 5,013 | ||||||||||||
|
|
|
|
|
|
|
|
|
|||||||||
| Gross profit |
16,173 | 16,599 | 13,763 | 11,591 | ||||||||||||
|
|
|
|
|
|
|
|
|
|||||||||
| Operating expenses |
||||||||||||||||
| Research and development |
7,789 | 6,013 | 4,488 | 2,866 | ||||||||||||
| General and administrative |
7,263 | 7,313 | 5,458 | 4,067 | ||||||||||||
| Sales and marketing |
17,145 | 17,094 | 11,944 | 12,123 | ||||||||||||
| Impairment loss on intangible assets |
— | 15,281 | — | — | ||||||||||||
| Change in fair value of contingent consideration |
4,832 | — | — | — | ||||||||||||
|
|
|
|
|
|
|
|
|
|||||||||
| Total operating expenses |
37,029 | 45,701 | 21,890 | 19,056 | ||||||||||||
|
|
|
|
|
|
|
|
|
|||||||||
| Loss from operations |
(20,856 | ) | (29,102 | ) | (8,127 | ) | (7,465 | ) | ||||||||
| Other income (expense) |
||||||||||||||||
| Interest income |
72 | 57 | 45 | 13 | ||||||||||||
| Interest expense |
(3,456 | ) | (5,611 | ) | (3,864 | ) | (1,345 | ) | ||||||||
| Loss on extinguishment of debt |
— | (251 | ) | — | — | |||||||||||
| Change in fair value of preferred stock warrants |
308 | (85 | ) | (110 | ) | 73 | ||||||||||
| Change in fair value of common stock warrants |
172 | (618 | ) | 1,348 | (224 | ) | ||||||||||
| Other income/(expense) |
9 | (151 | ) | (4 | ) | — | ||||||||||
|
|
|
|
|
|
|
|
|
|||||||||
| Total other expense |
(2,895 | ) | (6,659 | ) | (2,585 | ) | (1,483 | ) | ||||||||
|
|
|
|
|
|
|
|
|
|||||||||
| Net loss before income taxes |
(23,751 | ) | (35,761 | ) | (10,712 | ) | (8,948 | ) | ||||||||
| Income tax benefit |
— | 726 | — | — | ||||||||||||
|
|
|
|
|
|
|
|
|
|||||||||
| Net loss |
$ | (23,751 | ) | $ | (35,035 | ) | $ | (10,712 | ) | $ | (8,948 | ) | ||||
|
|
|
|
|
|
|
|
|
|||||||||
| Other comprehensive loss, net of tax: |
||||||||||||||||
| Unrealized gain/(loss) of marketable securities |
(23 | ) | 25 | 35 | (2 | ) | ||||||||||
| Total comprehensive loss |
$ | (23,774 | ) | $ | (35,010 | ) | $ | (10,677 | ) | $ | (8,950 | ) | ||||
|
|
|
|
|
|
|
|
|
|||||||||
| Net loss per share attributable to common stockholders |
||||||||||||||||
| Basic and diluted(1) |
$ | (68.28 | ) | $ | (100.52 | ) | $ | (30.74 | ) | $ | (17.64 | ) | ||||
|
|
|
|
|
|
|
|
|
|||||||||
| Shares used to calculate net loss attributable to common stockholders |
||||||||||||||||
| Basic and diluted |
348 | 349 | 348 | 507 | ||||||||||||
| Pro forma net loss per share attributable to common stockholders (unaudited) |
||||||||||||||||
| Basic and diluted(1) |
$ | (9.86 | ) | $ | (1.21 | ) | ||||||||||
|
|
|
|
|
|||||||||||||
| Weighted-average shares used to calculate pro forma net loss per share attributable to common stockholders (unaudited) |
||||||||||||||||
| Basic and diluted(1) |
3,544 | 7,469 | ||||||||||||||
|
|
|
|
|
|||||||||||||
| (1) | See Note 1 to our consolidated financial statements included elsewhere in this prospectus for an explanation of the method used to calculate the historical and pro forma net loss per share, basic and diluted, and the number of shares used in the computation of the per share amounts. |
46
| As of December 31, | As of September 30, |
|||||||||||
| 2011 | 2012 | 2013 | ||||||||||
| (unaudited) | ||||||||||||
| (in thousands) | ||||||||||||
| Consolidated Balance Sheet Data: |
||||||||||||
| Cash, restricted cash, cash equivalents and marketable securities(1) |
$ | 11,140 | $ | 5,682 | $ | 7,861 | ||||||
| Working capital |
12,742 | (5,171 | ) | (1,708 | ) | |||||||
| Total assets |
61,220 | 33,455 | 35,569 | |||||||||
| Long-term debt, including current portion |
41,986 | 17,893 | 17,917 | |||||||||
| Convertible preferred stock |
117,501 | 153,474 | 161,456 | |||||||||
| Total stockholders’ equity (deficit) |
(114,279 | ) | (148,282 | ) | (153,896 | ) | ||||||
| (1) | Restricted cash consists of cash we receive from payments of our accounts receivables held in a segregated account that must be applied to pay amounts owed under our revolving credit facility. |
47
MANAGEMENT’S DISCUSSION AND ANALYSIS OF
FINANCIAL CONDITION AND RESULTS OF OPERATIONS
You should read the following discussion and analysis of our financial condition and results of operations together with “Selected Consolidated Financial Data,” our consolidated financial statements and related notes appearing elsewhere in this prospectus. This discussion and analysis contains forward-looking statements based upon current beliefs, plans, expectations, intentions and projections that involve risks, uncertainties and assumptions, such as statements regarding our plans, objectives, expectations, intentions and projections. Our actual results and the timing of selected events could differ materially from those anticipated in these forward-looking statements as a result of several factors, including those set forth under “Risk Factors” and elsewhere in this prospectus.
Overview
We are a commercial biomaterial company focused on using our silicon nitride technology platform to develop, manufacture and sell a broad range of medical devices. We currently market spinal fusion products and are developing products for use in total hip and knee joint replacements. We believe our silicon nitride technology platform enables us to offer new and transformative products in the orthopedic and other medical device markets. We believe we are the first and only company to use silicon nitride in medical applications and over 14,000 of our intervertebral fusion devices have been implanted in patients.
We currently market our Valeo MC2 silicon nitride interbody spinal fusion devices in the United States and Europe for use in the cervical and thoracolumbar areas of the spine. We believe our Valeo devices have a number of advantages over existing products due to silicon nitride’s key characteristics, resulting in faster and more effective fusion and reduced risk of infection. Our first generation Valeo silicon nitride device received 510(k) regulatory clearance and a CE Mark in 2008. Based on surgeon feedback, we developed a second generation of Valeo products with design enhancements that improve surgeon control during implantation and stability post procedure. Earlier this year, we initiated a targeted launch of our second generation Valeo interbody fusion devices and expect to complete the full launch in the first half of 2014. We also market our Valeo composite interbody spinal fusion device made from both our solid MC2 and porous CSC silicon nitride in the Netherlands, Spain and Germany. We are currently conducting a prospective clinical trial in Europe, named CASCADE, comparing our Valeo composite silicon nitride interbody devices to PEEK interbody devices to obtain additional data to support 510(k) clearance in the United States. The trial is 100% enrolled. We expect results to be available in the second half of 2014. If this trial is successful, we plan to file a 510(k) submission with the FDA by mid-2015. In addition, in the first half of 2013, we initiated a Design and Build Program focused on collaborating with influential surgeons to develop customized silicon nitride spinal fusion products and instruments and the first products designed under this program were sold in the third quarter of 2013.
In addition to our silicon nitride-based spinal fusion products, we market a complementary line of non-silicon nitride spinal fusion products which allows us to provide surgeons and hospitals with a broader range of products. These products include three lines of spinal fusion devices and five types of orthobiologics, which are used by surgeons to help promote bone growth and fusion in spinal fusion procedures. Although our non-silicon nitride products have accounted for approximately 70% or more of our product revenues for the years ended December 31, 2012 and 2011 and the nine months ended September 30, 2013, we believe the continued promotion and potential for adoption of our silicon nitride products and product candidates, if approved, provides us the greatest opportunity to grow our business in new and existing markets and achieve our goal to become a leading biomaterial company.
We market and sell our products to surgeons and hospitals in the United States and select markets in Europe and South America through our established network of more than 50 independent sales distributors. A substantial portion of our product revenue has historically been derived from sales in the United States. Our largest customer, Bon Secours St. Mary’s Hospital, accounted for 17% and 14% of our product revenues for the years ended December 31, 2011 and 2012, respectively, and 15% of our product revenues for the nine months ended September 30, 2013. A significant portion of this hospital group’s purchases from us are non-silicon nitride products and its accounts receivable balance was approximately 11% of our total trade accounts receivable at September 30, 2013.
48
We plan to use our silicon nitride technology platform to expand our product offerings. We are incorporating our silicon nitride technology into components for use in total hip and knee replacement product candidates that we are, or plan on, developing in collaboration with a strategic partner. In addition, we believe our silicon nitride technology platform can be used for developing products in other markets and have developed prototypes for use in the dental, sports medicine and trauma markets. We believe our coating technology may be used to enhance our metal products as well as commercially-available metals, such as those used in spinal fusion, joint replacement and other medical products.
Components of our Results of Operations
We manage our business within one reportable segment, which is consistent with how our management reviews our business, makes investment and resource allocation decisions and assesses operating performance.
Product Revenue
We derive our product revenue primarily from the sale of spinal fusion devices and related products used in the treatment of spine disorders. Our product revenue is generated from sales to two types of customers: (1) surgeons and hospitals; and (2) stocking distributors. Most of our products are sold on a consignment basis through a network of independent sales distributors; however, we also sell our products to independent stocking distributors. Product revenue is recognized when all four of the following criteria are met: (1) persuasive evidence that an arrangement exists; (2) delivery of the products has occurred; (3) the selling price of the product is fixed or determinable; and (4) collectability is reasonably assured. We generate the majority of our revenue from the sale of inventory that is consigned to independent sales distributors that sell our products to surgeons and hospitals. For these products, we recognize revenue at the time we are notified the product has been used or implanted and a valid purchase order has been received. For all other transactions, we recognize revenue when title and risk of loss transfer to the stocking distributor, and all other revenue recognition criteria have been met. We generally recognize revenue from sales to stocking distributors at the time the product is shipped to the distributor. Stocking distributors, who sell the products to their customers, take title to the products and assume all risks of ownership at time of shipment. Our stocking distributors are obligated to pay within specified terms regardless of when, if ever, they sell the products. Our policy is to classify shipping and handling costs billed to customers as an offset to total shipping expense in the statement of operations, primarily within sales and marketing. In general, our customers do not have any rights of return or exchange.
We believe our product revenue from the sale of our silicon nitride based products and our non-silicon nitride products will increase due to our sales and marketing efforts and as we introduce new silicon nitride based products into the market, such as our second generation Valeo interbody spinal fusion products in the United States. We expect that our product revenue will continue to be primarily attributable to sales of our products in the United States, though, as we expand our sales and marketing efforts and market additional products abroad, such as our spinal fusion device incorporating our CSC, we expect international sales will increase.
Cost of Revenue
The expenses that are included in cost of revenue include all direct product costs if we obtained the product from third-party manufacturers and our in-house manufacturing costs for the products we manufacture. We obtain our non-silicon nitride products, including our metal and orthobiologic products, from third-party manufacturers, while we manufacture our silicon-nitride products in-house.
Specific provisions for excess or obsolete inventory and, beginning in 2013, the 2.3% excise tax on the sale of medical devices in the United States, are also included in cost of revenue. In addition, we pay royalties based on a percentage of our net after-tax profits attributable to the sale of specific products to some of our surgeon advisors that assisted us in the design, clearance or commercialization of a particular product, and these payments are recorded as cost of revenue.
Gross Profit
Our gross profit measures our product revenue relative to our cost of revenue. While we expect our cost of revenue to increase in absolute terms as our sales volume increases, we believe our gross profit will be higher as as we realize manufacturing efficiencies associated with our silicon nitride-based products.
49
Research and Development Expenses
Our net research and development costs are expensed as incurred. Research and development costs consist of engineering, product development, clinical trials, test-part manufacturing, testing, developing and validating the manufacturing process, manufacturing, facility and regulatory-related costs. Research and development expenses also include employee compensation, employee and non-employee stock-based compensation, supplies and materials, consultant services, and travel and facilities expenses related to research activities. To the extent that certain research and development expenses are directly related to our manufactured products, such expenses and related overhead costs are allocated to inventory.
We expect to incur additional research and development costs as we continue to develop new spinal fusion products such as our second generation Valeo products, our product candidates for total joint replacements, such as our total hip replacement product candidate, and our silicon nitride-coated metals which may increase our research and development expenses.
Sales and Marketing Expenses
Sales and marketing expenses primarily consist of salaries, benefits and other related costs, including stock-based compensation, for personnel employed in sales, marketing, medical education and training. In addition, our sales and marketing expenses include commissions and bonuses, generally based on a percentage of sales, to our sales managers and independent sales distributors. We provide our products in kits or banks that consist of a range of device sizes and separate instruments necessary to complete the surgical procedure. We generally consign our instruments to our distributors or our hospital customers that purchase the device used in spinal fusion surgery. Our sales and marketing expenses include depreciation of the surgical instruments.
We expect our sales and marketing expenses to continue to increase, including instrument set depreciation, as we introduce new products, such as our second generation Valeo spinal fusion products into the United States, and seek to enhance our commercial infrastructure, including increasing our marketing efforts and further educating our distributors. Additionally, we expect our commissions to continue to increase in absolute terms over time but remain approximately the same or decrease as a percentage of product revenue.
General and Administrative Expenses
General and administrative expenses primarily consist of salaries, benefits and other related costs, including stock-based compensation, for certain members of our executive team and other personnel employed in finance, legal, compliance, administrative, information technology, customer service, executive and human resource departments. General and administrative expenses include allocated facility expenses, related travel expenses and professional fees for accounting and legal services.
We expect our general and administrative expenses will increase due to costs associated with transitioning from a private to a public company and as we continue to grow our business.
50
Results of Operations
Nine Months Ended September 30, 2012 Compared to the Nine Months Ended September 30, 2013
The following table sets forth, for the periods indicated, our results of operations for the nine months ended September 30, 2012 and September 30, 2013 (in thousands):
| Nine Months Ended September 30, | Change | |||||||||||||||
| 2012 | 2013 | $ | % Change | |||||||||||||
| (unaudited) | ||||||||||||||||
| Product revenue |
$ | 17,126 | $ | 16,604 | $ | (522 | ) | (3.0 | )% | |||||||
| Cost of revenue |
3,363 | 5,013 | 1,650 | 49.1 | % | |||||||||||
|
|
|
|
|
|
|
|||||||||||
| Gross profit |
13,763 | 11,591 | (2,172 | ) | (15.8 | )% | ||||||||||
| Operating expenses: |
||||||||||||||||
| Research and development |
4,488 | 2,866 | (1,622 | ) | (36.1 | )% | ||||||||||
| General and administrative |
5,458 | 4,067 | (1,391 | ) | (25.5 | )% | ||||||||||
| Sales and marketing |
11,944 | 12,123 | 179 | 1.5 | % | |||||||||||
|
|
|
|
|
|
|
|||||||||||
| Total operating expenses |
21,890 | 19,056 | (2,834 | ) | (12.9 | )% | ||||||||||
|
|
|
|
|
|
|
|||||||||||
| Loss from operations |
(8,127 | ) | (7,465 | ) | 662 | (8.1 | )% | |||||||||
| Other expense, net |
(2,585 | ) | (1,483 | ) | 1,102 | (42.6 | )% | |||||||||
|
|
|
|
|
|
|
|||||||||||
| Net loss |
$ | (10,712 | ) | $ | (8,948 | ) | $ | 1,764 | (16.5 | )% | ||||||
|
|
|
|
|
|
|
|||||||||||
Product Revenue
The following table sets forth, for the periods indicated, our product revenue from sales of the indicated product category (in thousands):
| Nine Months Ended September 30, | Change | |||||||||||||||
| 2012 | 2013 | $ | % Change | |||||||||||||
| (unaudited) | ||||||||||||||||
| Silicon Nitride |
$ | 4,656 | $ | 5,331 | $ | 675 | 14.5 | % | ||||||||
| Non-Silicon Nitride |
12,470 | 11,273 | (1,197 | ) | (9.6 | )% | ||||||||||
|
|
|
|
|
|
|
|||||||||||
| Total Product Revenue |
$ | 17,126 | $ | 16,604 | $ | (522 | ) | (3.0 | )% | |||||||
|
|
|
|
|
|
|
|||||||||||
Total product revenue was $16.6 million in the nine months ended September 30, 2013 as compared to $17.1 million in the nine months ended September 30, 2012, a decrease of $0.5 million or 3.0%. This decrease in total product revenue was primarily attributable to our restructuring of our sales and marketing teams during the first quarter of this period, resulting from changes in our distribution network, the timing of the launch of our second generation Valeo products and a one-time sale of non-silicon nitride products to an international customer in the 2012 period with no corresponding sale in 2013. Sales of our silicon nitride products increased by $0.7 million, or 14.5%, in the nine months ended September 30, 2013 as compared to the same period of 2012. Non-silicon nitride sales decreased $1.2 million, or 9.6%, for the first nine months of 2013 compared to the same period of 2012, as the focus of the new sales team was primarily on silicon nitride product sales versus non-silicon nitride product sales.
The following table sets forth, for the periods indicated, our product revenue by geographic area (in thousands):
| Nine Months Ended September 30, | Change | |||||||||||||||
| 2012 | 2013 | $ | % Change | |||||||||||||
| (unaudited) | ||||||||||||||||
| Domestic |
$ | 16,050 | $ | 16,516 | $ | 466 | 2.9 | % | ||||||||
| International |
1,076 | 88 | (988 | ) | (91.8 | )% | ||||||||||
|
|
|
|
|
|
|
|||||||||||
| Total Product Revenue |
$ | 17,126 | $ | 16,604 | $ | (522 | ) | (3.0 | )% | |||||||
|
|
|
|
|
|
|
|||||||||||
51
Product revenue attributable to sales in the United States was $16.5 million in the nine months ended September 30, 2013, an increase of $0.5 million, or 2.9%, over the same period in 2012. Product revenue attributable to international sales was $0.1 million in the nine months ended September 30, 2013, a decrease of $1.0 million, or 91.8%, as compared to the same period in 2012. The decrease was primarily attributable to a one-time sale of non-silicon nitride products to an international customer in the 2012 period.
Cost of Revenue
Cost of revenue was $5.0 million in the nine months ended September 30, 2013 as compared to $3.4 million in the nine months ended September 30, 2012, an increase of $1.7 million, or 49.1%. This increase was primarily related to an increase in excess and obsolete inventory costs of $0.8 million related to our first generation Valeo products, the new 2.3% medical device excise tax in the United States, which totaled $0.3 million during the nine months ended September 30, 2013, and a volume increase in sales of our orthobiologic products resulting in additional costs of $0.1 million.
Gross Profit
Gross profit as a percentage of product revenue decreased by 10.6% to 69.8% for the nine months ended September 30, 2013 from 80.4% for the same period in 2012, primarily as a result of an increase in excess and obsolete inventory costs of $0.8 million related to our first generation Valeo products, the U.S. medical device excise tax of 2.3% on product revenue which became effective in January 2013 and a lower selling price per unit for our orthobiologic products in the nine months ended September 30, 2013 period as compared to the same period in 2012.
Research and Development Expenses
Research and development expenses were $2.9 million in the nine months ended September 30, 2013 as compared to $4.5 million in the nine months ended September 30, 2012, a decrease of $1.6 million, or 36.1%. This decrease was primarily due to our allocation, in the nine months ended September 30, 2013, of an additional $1.2 million of overhead costs to inventory as a result of the ramp-up phase for our second generation Valeo products, which overhead costs had been allocated to research and development expenses in the prior comparable period. The decrease in research and development expenses also reflected a decrease of $0.2 million in employee compensation including taxes, benefits and stock compensation and a $0.3 million decrease in depreciation expense.
General and Administrative Expenses
General and administrative expenses were $4.1 million in the nine months ended September 30, 2013 as compared to $5.5 million in the nine months ended September 30, 2012, a decrease of $1.4 million, or 25.5%. This decrease was primarily due to decreases of $1.0 million in amortization expense and $0.7 million in legal and patent expense, partially offset by a $0.2 million increase of employee compensation, a $0.2 million increase in accounting and consulting services, and a $0.1 million increase in recruiting expense.
Sales and Marketing Expenses
Sales and marketing expenses were $12.1 million in the nine months ended September 30, 2013 as compared to $11.9 million in the nine months ended September 30, 2012, an increase of $0.2 million, or 1.5%. This increase was primarily due to an increase of $0.8 million in commission expense to our sales distributors to support increased silicon nitride sales volume, partially offset by decreases of $0.2 million in depreciation expense, $0.2 million in trade show expense and $0.2 million in instrument maintenance expense.
Other Expense, Net
We incurred other expense of $1.5 million in the nine months ended September 30, 2013 as compared to $2.6 million in the nine months ended September 30, 2012, a decrease of $1.1 million, or 42.6%. This decrease in other expense was primarily due to a $2.5 million reduction in interest expense, partially offset by a net change of $1.4 million in fair value of our common and preferred stock warrants.
52
Year Ended December 31, 2011 Compared to the Year Ended December 31, 2012
The following table sets forth our results of operations for the years ended December 31, 2011 and December 31, 2012 (in thousands):
| Year ended December 31, | Change | |||||||||||||||
| 2011 | 2012 | $ | % Change | |||||||||||||
| Product revenue |
$ | 20,261 | $ | 23,065 | $ | 2,804 | 13.8 | % | ||||||||
| Cost of revenue |
4,088 | 6,466 | 2,378 | 58.2 | % | |||||||||||
|
|
|
|
|
|
|
|||||||||||
| Gross profit |
16,173 | 16,599 | 426 | 2.6 | % | |||||||||||
| Operating expenses: |
||||||||||||||||
| Research and development |
7,789 | 6,013 | (1,776 | ) | (22.8 | )% | ||||||||||
| General and administrative |
7,263 | 7,313 | 50 | 0.1 | % | |||||||||||
| Sales and marketing |
17,145 | 17,094 | (51 | ) | (0.0 | )% | ||||||||||
| Impairment loss on intangible assets |
— | 15,281 | 15,281 | N/A | ||||||||||||
| Change in fair value of contingent consideration |
4,832 | — | (4,832 | ) | N/A | |||||||||||
|
|
|
|
|
|
|
|||||||||||
| Total operating expenses |
37,029 | 45,701 | 8,672 | 23.4 | % | |||||||||||
|
|
|
|
|
|
|
|||||||||||
| Loss from operations |
(20,856 | ) | (29,102 | ) | (8,246 | ) | 39.5 | % | ||||||||
| Other expense, net |
(2,895 | ) | (6,659 | ) | (3,763 | ) | 130.0 | % | ||||||||
|
|
|
|
|
|
|
|||||||||||
| Net loss before income taxes |
(23,751 | ) | (35,761 | ) | (12,010 | ) | 50.6 | % | ||||||||
| Income tax benefit |
— | 726 | 726 | N/A | ||||||||||||
|
|
|
|
|
|
|
|||||||||||
| Net loss |
$ | (23,751 | ) | $ | (35,035 | ) | $ | (11,283 | ) | 47.5 | % | |||||
|
|
|
|
|
|
|
|||||||||||
Product Revenue
The following table sets forth, for the periods indicated, our product revenue by product category (in thousands):
| Year Ended December 31, | Change | |||||||||||||||
| 2011 | 2012 | $ | % Change | |||||||||||||
| Silicon Nitride |
$ | 6,221 | $ | 6,578 | $ | 357 | 5.7 | % | ||||||||
| Non-Silicon Nitride |
14,040 | 16,487 | 2,447 | 17.4 | % | |||||||||||
|
|
|
|
|
|
|
|||||||||||
| Total Product Revenue |
$ | 20,261 | $ | 23,065 | $ | 2,804 | 13.8 | % | ||||||||
|
|
|
|
|
|
|
|||||||||||
Total product revenue was $23.1 million in 2012 as compared to $20.3 million in 2011, an increase of $2.8 million or 13.8%. The increase in total product revenue was primarily attributable to higher sales of our non-silicon nitride products, which increased by $2.4 million, or 17.4%, in the year ended December 31, 2012 as compared to 2011. Product revenues in 2012 were favorably impacted by a one-time sale of non-silicon nitride products to an international customer. Sales of our silicon nitride products increased $0.4 million, or 5.7%, for the year ended December 31, 2012 compared to 2011.
The following table sets forth, for the periods indicated, our product revenue from by geographic area (in thousands):
| Year Ended December 31, | Change | |||||||||||||||
| 2011 | 2012 | $ | % Change | |||||||||||||
| Domestic |
$ | 19,826 | $ | 21,847 | $ | 2,021 | 10.2 | % | ||||||||
| International |
435 | 1,218 | 783 | 180.0 | % | |||||||||||
|
|
|
|
|
|
|
|||||||||||
| Total Product Revenue |
$ | 20,261 | $ | 23,065 | $ | 2,804 | 13.8 | % | ||||||||
|
|
|
|
|
|
|
|||||||||||
53
Product revenue attributable to sales in the United States was $21.8 million in the year ended December 31, 2012, an increase of $2.0 million, or 10.2%, over 2011. Product revenue attributable to international sales was $1.2 million in the year ended December 31, 2012, an increase of $0.8 million, or 180%, as compared to 2011, which was primarily attributable to a one-time sale of non-silicon nitride products to an international customer in 2012.
Cost of Revenue
Cost of revenue was $6.5 million in 2012 as compared to $4.1 million in 2011, an increase of $2.4 million, or 58.2%. This increase was primarily the result of a $1.0 million charge related to excess and obsolete inventory, a $0.6 million charge to inventory scrap adjustments and a $0.6 million charge resulting from a volume increase in sales of our orthobiologic products in 2012.
Gross Profit
Gross profit as a percentage of product revenue decreased by 7.8%, to 72.0%, for the year ended December 31, 2012, from 79.8% for the year ended December 31, 2011. This decrease was primarily as a result of a $1.0 million charge related to excess and obsolete inventory, higher than normal inventory scrap adjustments and increased acquisition costs for our orthobiologic products, partially offset by increased sales in 2011.
Research and Development Expenses
Research and development expenses were $6.0 million in 2012 as compared to $7.8 million in 2011, a decrease of $1.8 million or 22.8%. This decrease was primarily due to a decrease of $0.9 million in employee compensation including taxes, benefits and stock compensation, $0.4 million in depreciation expense and $0.4 million in overhead allocation expense related to the manufacture of our silicon nitride products.
General and Administrative Expenses
General and administrative expenses were $7.3 million in both 2012 and 2011.
Sales and Marketing Expenses
Sales and marketing expenses were $17.1 million in both 2012 and 2011.
Impairment Loss on Intangible Assets
Impairment loss on intangible assets was $15.3 million in 2012 relating to assets we obtained in our acquisition of US Spine, Inc., or US Spine. The amount of the impairment loss was determined during management’s annual impairment review and resulted from lower sales of certain products and customers we acquired in the US Spine transaction than originally expected. There was not an impairment loss on intangible assets during 2011 and we do not expect to incur similar impairment losses in 2013.
Change in Fair Value of Contingent Consideration
Change in fair value of contingent consideration was $4.8 million in 2011. There was no change in fair value of contingent consideration in 2012.
Other Expense, Net
Other expense was $6.7 million in 2012 and $2.9 million in 2011, an increase of $3.8 million, or 130.0%. The increase was primarily attributable to an increase of interest expense of $2.2 million, a change in fair value of stock warrants of $1.2 million and a loss on extinguishment of debt of $0.3 million during 2012.
Liquidity and Capital Resources
For the years ended December 31, 2011 and 2012 and the nine months ended September 30, 2012 and 2013, we incurred a net loss of $23.8 million, $35.0 million, $10.7 million and $8.9 million, respectively, and used cash in operations of $14.9 million, $9.7 million, $6.4 million and $5.5 million, respectively. We have an accumulated deficit of $131.6 million as of December 31, 2012 and $140.6 million as of September 30, 2013. With the exception of a small net income for the years ended December 31, 2002 and 1999, we have incurred net losses in each year
54
since inception. To date, our operations have been principally financed from proceeds from the issuance of convertible preferred stock and common stock, convertible debt and bank debt and, to a lesser extent, cash generated from product sales. Since January 2011, we issued the following securities to help fund our operations:
| • | between March 2011 and February 2012, we issued aggregate principal amount of $29.8 million of Senior Secured Subordinated 6%/8% Convertible Promissory Notes, or the Senior Secured Notes, and warrants to purchase an aggregate of 288,685 shares of our common stock at an exercise price of $51.55 per share. All outstanding Senior Secured Notes were converted into 14,887,500 shares of our Series F convertible preferred stock in December 2012 contemporaneously with our entering into a new term loan and a revolving credit facility with General Electric Capital Corporation, or GE Capital, and Zions First National Bank, or the GE Secured Lending Facility; |
| • | in February 2013, we issued an aggregate of 178,516 shares of our common stock upon exercise of warrants and the sale of additional shares of our common stock at $17.53 per share for an aggregate purchase price of $3.1 million. We also issued each investor purchasing shares of our common stock through the exercise of warrants new warrants to purchase shares of our common stock at an exercise price of $17.53 per share; and |
| • | in August and September 2013, we issued an aggregate of 94.8 units, each unit consisting of 50,000 shares of our Series F convertible preferred stock and a warrant to acquire 970 shares of our common stock at an exercise price of $25.77 per share, for gross proceeds of $9.5 million. |
As of December 31, 2012 and September 30, 2013, we had approximately $5.7 million and $7.9 million, respectively, in cash, cash equivalents, restricted cash and marketable securities. Restricted cash, which was $260,459 and $298,493 at December 31, 2012 and September 30, 2013, respectively, consists of cash balances in transit from a segregated account that must first be applied to pay down any outstanding balance on the revolving credit facility portion of the GE Secured Lending Facility. In order to finance the continued growth in product sales, to invest in further product development and to otherwise satisfy obligations as they mature, we may need to seek additional financing through the issuance of common stock, preferred stock, convertible or non-convertible debt financing. Additional funding, however, may not be available to us on acceptable terms, or at all. If we are unable to access additional funds when needed, we may not be able to continue the development of our silicon nitride technology, our products or our product candidates or we could be required to delay, scale back or eliminate some or all of our development programs and other operations. Any additional equity financing, if available to us, may not be available on favorable terms, will most likely be dilutive to our current stockholders, and debt financing, if available, may involve restrictive covenants. We expect our existing cash and cash equivalents, our expected product revenue and the net proceeds of this offering to support our operations through at least the next 15 months.
Pursuant to its terms, we must repay our $18.0 million term loan with GE Capital over a period of 30 months, which began in January 2014. We have been in covenant default under the agreement in the past, but we were not in default at September 30, 2013. However, because we may have been in default on or before December 31, 2013 if we did not receive additional funding, we classified the entire obligation as a current liability. We expect to use a portion of the net proceeds of this offering to service the outstanding borrowings on the GE Secured Lending Facility. We must pay GE Capital a repayment fee of $720,000 upon prepayment in full or at scheduled maturity of the term loan. The GE Secured Lending Facility also has minimum liquidity covenants that require us to maintain minimum levels of cash, cash equivalents and availability under the revolving credit facility, which can restrict our ability to use our cash and cash equivalents. We were in default of this liquidity covenant in November 2013, and, in December 2013, we amended the terms of the GE Secured Lending Facility to allow for a temporary waiver effective from November 1, 2013 through January 31, 2014 of the liquidity covenant under the agreement for a fee of $860,000, payable by March 1, 2014, provided that the fee is reduced to $645,000 if the facility is repaid on or before February 28, 2014. In addition, we agreed to an additional credit reserve in the amount of $0.5 million, bringing the total reserve to $1.0 million. On January 28, 2014, we obtained an additional waiver of the liquidity covenant from GE Capital through February 28, 2014 and agreed to increase the credit reserve under this facility by an additional $0.5 million, bringing the total reserve to $1.5 million. We also agreed to pay the lenders a fee of $200,000 on March 31, 2014 in connection with the additional waiver if the facility is not repaid on or before March 31, 2014. This fee is in addition to the fee required in connection with the prior waiver.
55
Going Concern
Our ability to access capital when needed is not assured and, if not achieved on a timely basis, will materially harm our business, financial condition and results of operations. These uncertainties create substantial doubt about our ability to continue as a going concern. Without the expected proceeds from this offering, our existing capital resources will be insufficient to fund our operations through the end of February 2014. Our independent registered public accounting firm included an explanatory paragraph regarding substantial doubt about our ability to continue as a going concern in their report on our annual financial statements for the fiscal year ended December 31, 2012 included elsewhere in this prospectus. The financial information throughout this prospectus and the financial statements included elsewhere in this prospectus have been prepared on a basis which assumes that we will continue as a going concern, which contemplates the realization of assets and the satisfaction of liabilities and commitments in the normal course of business. This financial information and statements do not include any adjustments that may result from the outcome of this uncertainty.
Cash Flows
The following table summarizes, for the periods indicated, cash flows from operating, investing and financing activities (in thousands):
| Year ended December 31, | Nine Months Ended September 30, | |||||||||||||||
| 2011 | 2012 | 2012 | 2013 | |||||||||||||
| (unaudited) | ||||||||||||||||
| Net cash used in operating activities |
$ | (14,908 | ) | $ | (9,730 | ) | $ | (6,392 | ) | $ | (5,485 | ) | ||||
| Net cash provided by (used in) investing activities |
(9,170 | ) | 4,275 | 5,815 | 1,072 | |||||||||||
| Net cash provided by financing activities |
23,750 | 4,866 | 5,293 | 9,234 | ||||||||||||
|
|
|
|
|
|
|
|
|
|||||||||
| Net change in cash and cash equivalents |
$ | (328 | ) | $ | (589 | ) | $ | 4,716 | $ | 4,821 | ||||||
|
|
|
|
|
|
|
|
|
|||||||||
Net Cash Used in Operating Activities
Net cash used in operating activities was $5.5 million in the nine months ended September 30, 2013, compared to $6.4 million used in the nine months ended September 30, 2012, a decrease of $0.9 million, or 14.2%. The decrease in net cash used in operating activities was primarily attributable to a $1.8 million decrease in net loss, a $1.6 million decrease in trade accounts receivable mostly due to improved collection and cash management efforts, a $1.6 million increase in the change in fair value of common stock warrant liability, and $1.3 million increase in accounts payable and accrued liabilities. These amounts were partially offset by a $1.8 million increase in prepaid expenses and other current assets, a $1.3 million decrease in non-cash interest expense on convertible debt during the nine months ended September 30, 2012, a $1.0 million decrease in amortization of intangible assets, a $0.9 million increase in inventory, and a $0.4 million decrease in stock-based compensation.
Net cash used in operating activities was $9.7 million in 2012, compared to $14.9 million used in 2011, a decrease of $5.2 million, or 34.7%. This decrease in net cash used in operating activities was primarily attributable to a $11.3 million decrease in net loss, a $4.8 million decrease in the change in fair value of contingent consideration, a $1.4 million decrease in depreciation expense, a $1.0 million decrease in prepaid expense and other current assets, a $0.3 million decrease in bad debt expense, a $0.1 million decrease in amortization of interest expense on a promissory note we issued in connection with our acquisition of US Spine and a $0.1 million decrease in accounts payable and accrued liabilities during the year ended December 31, 2012. These amounts were partially offset by a $15.3 million increase in write-down of intangible assets, a $4.4 million increase in inventories, a $1.3 million increase in non-cash interest expense on convertible debt, a $1.0 million increase in write-down of excess and obsolete inventory, a $0.8 million increase in change in fair value of common stock warrant liability, a $0.4 million increase in change in fair value of preferred stock warrant liability, a $0.3 million increase in loss on extinguishment of debt, a $0.2 million increase in stock based compensation, a $0.2 million increase on the loss on the sale of equipment and $0.1 million increase in trade accounts receivable during the year ended December 31, 2012.
Net Cash Provided by (Used in) Investing Activities
Net cash provided by investing activities was $1.1 million in the nine months ended September 30, 2013, compared to $5.8 million provided in the nine months ended September 30, 2012, a decrease of $4.7 million, or
56
81.6%. This decrease in net cash provided by investing activities was primarily attributable to a $3.6 million decrease in the proceeds from maturities of marketable securities and a $1.1 million increase in the purchase of property and equipment.
Net cash provided by investing activities was $4.3 million in 2012, compared to cash used in investing activities of $9.2 million in 2011, an increase of $13.5 million. This increase in net cash provided in investing activities was primarily attributable to a $10.1 million reduction in the purchase of marketable securities, a $2.9 million increase in proceeds from maturities of marketable securities and a $0.8 million decrease in the purchase of property and equipment, partially offset by a $0.3 million increase in restricted cash during the year ended December 31, 2012.
Net Cash Provided by Financing Activities
Net cash provided by financing activities was $9.2 million in the nine months ended September 30, 2013, compared to $5.3 million provided in the nine months ended September 30, 2012, an increase of $3.9 million, or 74.5%. This increase in net cash provided by financing activities was primarily attributable to an $8.9 million increase in net proceeds from the issuance of convertible preferred stock and a $2.9 million increase in proceeds from the exercise of common stock warrants and options, partially offset by a $4.8 million decrease in net proceeds from the issuance of convertible debt and a $3.1 million increase in net payments on our line of credit.
Net cash provided by financing activities was $4.9 million in 2012, compared to $23.7 million provided in 2011, a decrease of $18.9 million, or 79.5%. This decrease in net cash provided by financing activities was primarily attributable to a $15.5 million payment to extinguish our old bank debt in December 2012 and an $18.8 million decrease in the proceeds from issuance of convertible debt and warrants, net of issuance, partially offset by a $14.9 million increase in the proceeds from issuance of long-term debt and a $0.6 million increase in the proceeds from our line of credit during the year ended December 31, 2012.
Indebtedness
In December 2012, we entered into the GE Secured Lending Facility, which consists of a $18.0 million term loan and up to $3.5 million revolving credit facility with GE Capital, as agent and lender, and Zions First National Bank, as lender. We pledged all of our assets as collateral for the loans. The revolving line of credit is secured by our accounts receivable, based on certain defined criteria. The term loan consisted of interest only payments until January 1, 2014. Beginning in January 2014, monthly interest payments as well as principal payments of approximately $600,000 each are required for a period of 30 months. We were in default of the liquidity covenant under the GE Secured Lending Facility in November 2013, and, in December 2013, we amended the terms of the GE Secured Lending Facility to allow for a temporary waiver effective from November 1, 2013 through January 31, 2014 of the liquidity covenant under the agreement discussed below. In addition, we agreed to increase the credit reserve from $0.5 million to $1.0 million. On January 28, 2014, we obtained an additional waiver of the liquidity covenant from GE Capital through February 28, 2014 and agreed to increase the credit reserve under this facility by an additional $0.5 million, bringing the total reserve to $1.5 million.
The term loan bears interest at the fixed rate of 7.5% per annum, while the line of credit had an interest rate of 7.0% at September 30, 2013, which is based on the variable rate of 5.5% plus the higher of (i) 1.5% and (ii) the three-month LIBOR, determined as of two London business days divided by a number equal to 1.0 minus the aggregate of the rates of reserve requirements on the day that is two London business days prior to the beginning of the interest period for Eurocurrency funding that are required to be maintained by a member bank of the Federal Reserve System. The agreement includes a non-refundable final payment fee equal to 4% of the original principal amount of the term loan, or $720,000, upon prepayment in full or scheduled maturity of the term loan, as well as an annual management fee equal to $15,000 per year.
The loan agreement includes certain financial covenants related to monthly cash burn and minimum liquidity, days sales outstanding of accounts receivable balances, annual payment restrictions to our directors and other financial reporting requirements. The liquidity covenant requires us to maintain cash and cash equivalents and availability under the revolving credit facility equal to the greater of $1.5 million (exclusive of availability under the revolving credit facility) or six times our monthly cash burn, as defined in the revolving credit facility. As of September 30, 2013, six times our monthly cash burn equaled $7.1 million. This covenant may significantly limit
57
our ability to use our cash and cash equivalents to fund our operations. We were obligated to raise additional equity financing under the loan agreement which we satisfied upon the closing of the $7.5 million financing in August 2013. The loan agreement provides for an unused credit facility fee of 0.75% per annum of the unused portion of the line of credit, payable monthly in arrears. We paid a total of approximately $333,000 in fees and commissions associated with entering into this facility, of which approximately $264,000 was capitalized as debt issuance costs and the remaining $69,000 was recorded as interest expense in 2012.
In connection with entering into the new term loan and revolving credit facility with GE Capital in December 2012, we repaid all amounts outstanding under our term loans and line of credit facility with a previous lender, which totaled $18.0 million in principal and approximately $36,000 in accrued interest. We paid $107,500 in commissions related to this repayment, of which approximately $70,000 was capitalized as debt issuance costs and the remaining $37,500 was recorded as interest expense in 2012. We expect to use a portion of the net proceeds of this offering to service the outstanding debt under the term loan as well as our revolving credit facility with GE Capital.
Contractual Obligations and Commitments
The following table summarizes our outstanding contractual obligations as of September 30, 2013. There have been no material changes in our remaining contractual obligations since that time (in thousands).
| Payments Due By Period | ||||||||||||||||||||
| Total | Less than 1 Year(1)(2) |
1-3 Years(2) |
3-5 Years |
After 5 Years |
||||||||||||||||
| Long Term Debt Obligations |
$ | 18,000 | $ | — | $ | 18,000 | $ | — | $ | — | ||||||||||
| Operating Lease Obligations |
5,752 | 210 | 1,752 | 1,848 | 1,942 | |||||||||||||||
|
|
|
|
|
|
|
|
|
|
|
|||||||||||
| Total |
$ | 23,752 | $ | 210 | $ | 19,752 | $ | 1,848 | $ | 1,942 | ||||||||||
|
|
|
|
|
|
|
|
|
|
|
|||||||||||
| (1) | Less than 1 year refers to the remaining three months of 2013. |
| (2) | Does not include the $720,000 final payment fee we must pay upon prepayment in full or scheduled maturity of the term loan, the $15,000 per year annual management fee, or the amendment fee of up to $860,000, which is due by March 1, 2014. |
The information above reflects only payment obligations that are fixed and determinable. Our commitments for long-term debt relate to our term loans with GE Capital and our commitment to our operating lease for our corporate headquarters and manufacturing facility in Salt Lake City, Utah. The above table does not include any of the contractual obligations with respect to royalties payable upon sales of certain of our products as none of our arrangements contain minimum royalty payments. We also do not have contractually minimum purchase commitments for the supply of any of our raw materials, products or instruments.
Off-Balance Sheet Arrangements
We do not have any off-balance sheet arrangements, as defined in Item 303(a)(4) of Regulation S-K.
Related-Party Transactions
For a description of our related-party transactions, see “Certain Relationships and Related Party Transactions.”
Seasonality and Backlog
Our business is generally not seasonal in nature. However, our sales may be influenced by summer vacation and winter holiday periods during which we believe fewer spinal fusion surgeries are conducted. Our sales generally consist of products that are in stock with us or maintained at hospitals or with our sales distributors. Accordingly, we do not have a backlog of sales orders.
Critical Accounting Policies and Estimates
The preparation of the consolidated financial statements requires us to make assumptions, estimates and judgments that affect the reported amounts of assets and liabilities, the disclosures of contingent assets and liabilities as of the date of the consolidated financial statements, and the reported amounts of product revenues
58
and expenses during the reporting periods. Certain of our more critical accounting policies require the application of significant judgment by management in selecting the appropriate assumptions for calculating financial estimates. By their nature, these judgments are subject to an inherent degree of uncertainty. On an ongoing basis, we evaluate our judgments, including those related to inventories, recoverability of long-lived assets and the fair value of our common stock. We use historical experience and other assumptions as the basis for our judgments and making these estimates. Because future events and their effects cannot be determined with precision, actual results could differ significantly from these estimates. Any changes in those estimates will be reflected in our consolidated financial statements as they occur. As an “emerging growth company,” we have elected to delay the adoption of new or revised accounting standards until those standards would otherwise apply to private companies. As a result, our financial statements may not be comparable to those of other public companies. While our significant accounting policies are more fully described in the footnotes to our consolidated financial statements included elsewhere in this prospectus, we believe that the following accounting policies and estimates are most critical to a full understanding and evaluation of our reported financial results. The critical accounting policies addressed below reflect our most significant judgments and estimates used in the preparation of our consolidated financial statements.
Revenue Recognition
We derive our product revenue primarily from the sale of spinal fusion devices and related products used in the treatment of spine disorders. Our product revenue is generated from sales to two types of customers: (1) surgeons and hospitals; and (2) stocking distributors. Most of our products are sold on a consignment basis through a network of independent sales distributors; however, we also sell our products to independent stocking distributors. Product revenue is recognized when all four of the following criteria are met: (1) persuasive evidence that an arrangement exists; (2) delivery of the products has occurred; (3) the selling price of the product is fixed or determinable; and (4) collectability is reasonably assured. We generate the majority of our revenue from the sale of inventory that is consigned to independent sales distributors that sell our products to surgeons and hospitals. For these products, we recognize revenue at the time we are notified the product has been used or implanted and a valid purchase order has been received. For all other transactions, we recognize revenue when title and risk of loss transfer to the stocking distributor, and all other revenue recognition criteria have been met. We generally recognize revenue from sales to stocking distributors at the time the product is shipped to the distributor. Stocking distributors, who sell the products to their customers, take title to the products and assume all risks of ownership at time of shipment. Our stocking distributors are obligated to pay within specified terms regardless of when, if ever, they sell the products. Our policy is to classify shipping and handling costs billed to customers as an offset to total shipping expense in the statement of operations, primarily within sales and marketing. In general, our customers do not have any rights of return or exchange.
Accounts Receivable and Allowance for Doubtful Accounts
The majority of our accounts receivable is composed of amounts due from hospitals or surgical centers. Accounts receivable are carried at cost less an allowance for doubtful accounts. On a regular basis, we evaluate accounts receivable and estimate an allowance for doubtful accounts, as needed, based on various factors such as customers’ current credit conditions, length of time past due, and the general economy as a whole. Receivables are written off against the allowance when they are deemed uncollectible.
Inventories
Inventories are stated at the lower of cost or market, with cost for manufactured inventory determined under the standard cost method which approximates the first-in first-out method. Manufactured inventory consists of raw material, direct labor and manufacturing overhead cost components. Inventories purchased from third-party manufacturers are stated at the lower of cost or market using the first-in, first out method. We review the carrying value of inventory on a periodic basis for excess or obsolete items and record an expense for the identified items as necessary. We have made adjustments to, and it is reasonably possible that we may be required to make further adjustments to, the carrying value of inventory in future periods. We hold some consigned inventory at distributors and other customer locations where revenue recognition criteria have not yet been met.
59
Long-Lived Assets and Goodwill
Periodically we assess potential impairment of our long-lived assets, which include property, equipment, and acquired intangible assets. We perform an impairment review whenever events or changes in circumstances indicate that the carrying value may not be recoverable. Factors we consider important which could trigger an impairment review include, but are not limited to, significant under-performance relative to historical or projected future operating results, significant changes in the manner of use of the acquired assets or our overall business strategy, and significant industry or economic trends. When we determine that the carrying value of a long-lived asset may not be recoverable based upon the existence of one or more of the above indicators, we determine the recoverability by comparing the carrying amount of the asset to net future undiscounted cash flows that the asset is expected to generate and recognize an impairment charge equal to the amount by which the carrying amount exceeds the fair market value of the asset. We amortize intangible assets on a straight-line basis over their estimated useful lives.
For indefinite lived intangible assets that are not subject to amortization, the impairment test consists of a comparison of the fair value of an intangible asset with its carrying amount. If the carrying amount of an intangible asset exceeds its fair value, an impairment loss is recognized in an amount equal to that excess.
Our management noted that certain US Spine product sales and sales to certain acquired US Spine customers during the one-year period ended December 31, 2012 had been less than expected relative to the forecasted revenues at the time of our acquisition of US Spine. This indicator prompted us to question whether the carrying value of our long-lived and indefinite lived intangible assets would be recoverable. We compared the carrying amount of the assets to net future undiscounted cash flows that the intangible assets are expected to generate, and concluded that an impairment existed. We estimated the fair values of the intangible assets and recognized an impairment loss of approximately $15.3 million in the year ended December 31, 2012.
As of December 31, 2012, we had indefinite lived intangible assets of $0.4 million and $4.8 million of long-lived intangible assets which are subject to our impairment analysis. Should conditions change such that our estimates of associated undiscounted cash flows would not support the unamortized carrying value of specific assets, we could have further impairments. The risk of future impairment of amortizable intangible assets is mitigated by the excess of the undiscounted cash flows over the net carrying value (after impairment was recorded) of approximately 150%.
The income approach used in our impairment analysis considered management’s business plans and projections as the basis for expected cash flows for the next ten years and a 5% residual growth rate thereafter. We also used a weighted average discount rate of 17%, a weighted average revenue growth rate ranging from (58)% to 10% and an EBITDA margin ranging from approximately 9% to 12.4% for the analysis.
Our long-lived assets include surgical instruments used by spine surgeons during surgical procedures to facilitate the implantation of our products. There are no contractual terms with respect to the usage of our instruments by our customers. Surgeons are under no contractual commitment to use our instruments. We maintain ownership of these instruments and, when requested, we allow the surgeons to use the instruments to facilitate implantation of our related products. We do not currently charge for the use of our instruments and there are no minimum purchase commitments of our products. As our surgical instrumentation is used numerous times over several years, often by many different customers, instruments are capitalized as property and equipment once they have been placed in service. Once placed in service, instruments are carried at cost, less accumulated depreciation. Depreciation is computed using the straight-line method based on average estimated useful lives. Estimated useful lives of surgical instruments are determined based on a variety of factors including in reference to associated product life cycles, and average three years. As instruments are used as tools to assist surgeons, depreciation of instruments is recognized as a sales and marketing expense. Instrument depreciation expense was $2.3 million, $1.2 million, $0.9 million and $0.7 million for the years ended December 31, 2011 and 2012 and the nine months ended September 30, 2012 and 2013, respectively.
We review our long-lived assets for impairment whenever events or changes in circumstances indicate that the carrying value of the assets may not be recoverable. An impairment loss would be recognized when estimated future undiscounted cash flows relating to the assets are less than the assets’ carrying amount. An impairment loss is measured as the amount by which the carrying amount of an asset exceeds its fair value.
60
We test goodwill for impairment annually as of December 31, or whenever events or changes in circumstances indicate that goodwill may be impaired. We initially assess qualitative factors to determine whether the existence of events or circumstances leads to a determination that it is more-likely-than-not that the fair value of a reporting unit is less than its carrying amount. For goodwill impairment testing purposes, we consider the value of our equity, including the value of our convertible preferred stock, in the total carrying value of our single reporting unit. If, after assessing the totality of events or circumstances, we determine it is more-likely-than-not that the fair value of our reporting unit is less than its carrying amount, then we perform a first step analysis by comparing the carrying amount of net assets to the fair value of our single reporting unit. If the fair value is determined to be less than the carrying amount, a second step analysis is performed to compute the amount of impairment as the difference between the implied estimated fair value of goodwill and the carrying amount.
At December 31, 2012, the balance of goodwill resulting from the US Spine acquisition was $6.2 million. We measure the fair value of our reporting unit for purposes of our impairment test utilizing the income approach. The income approach is calculated based on management’s best estimates of future cash flows which depend primarily upon revenue growth, discount rate, terminal value and long-term growth rate and total operating expenses. There is a certain degree of uncertainty associated with these key assumptions and there are potential events and circumstances that could reasonably be expected to affect these key assumptions, such as (i) significant decline in product revenue or failure to increase revenue in future years, (ii) failure of the new Design and Build Program to increase revenue as expected, (iii) significant increases in the manufacturing costs or acquisition costs of our inventory and (iv) lack of clearance or approval from the FDA for any of our future product candidates.
The income approach considered management’s business plans and projections, with revenue growth rates ranging from 45.1% to 5%, as the basis for expected cash flows for the next six years and a 5% residual growth rate thereafter. We also used a weighted average discount rate of 17% for the analysis. Other significant estimates used in the analysis include gross profit margins and working capital changes. We noted the fair value of the reporting unit exceeded its carrying amount by more than $50.0 million using these assumptions.
A hypothetical increase in the weighted average discount rate of 0.5% would decrease the calculated fair value as a percentage of carrying amount by 5.1%. A hypothetical decrease in the residual growth rate of 0.5% would decrease the calculated fair value as a percent of carrying amount by 3.3%.
Income Taxes
We recognize deferred tax assets and liabilities for the future tax consequences attributable to the differences between the financial statement carrying value of existing assets and liabilities and their respective tax bases. Deferred tax assets and liabilities are measured using enacted tax rates in effect for the fiscal year in which those temporary differences are expected to be recovered or settled. Valuation allowances are established when necessary to reduce deferred tax assets to the amount expected to be realized.
We operate in various tax jurisdictions and are subject to audit by various tax authorities. We provide for tax contingencies whenever it is deemed probable that a tax asset has been impaired or a tax liability has been incurred for events such as tax claims or changes in tax laws. Tax contingencies are based upon their technical merits relative tax law and the specific facts and circumstances as of each reporting period. Changes in facts and circumstances could result in material changes to the amounts recorded for such tax contingencies.
We recognize uncertain income tax positions taken on income tax returns at the largest amount that is more-likely than-not to be sustained upon audit by the relevant taxing authority. An uncertain income tax position will not be recognized if it has less than a 50% likelihood of being sustained.
Our policy for recording interest and penalties associated with uncertain tax positions is to record such items as a component of our income tax provision. For the years ended December 31, 2011 and 2012 and for the nine months ended September 30, 2012 and 2013, we did not record any material interest income, interest expense or penalties related to uncertain tax positions or the settlement of audits for prior periods.
61
Stock-Based Compensation Expense
Common Stock Valuation
Historically, our board of directors has determined the fair value of the common stock with assistance from management and based upon information available at the time of grant. The valuation of our common stock requires us to make complex and subjective judgments. We considered a combination of valuation methodologies, including income, market and transaction approaches. The most significant factors considered by our board of directors when determining the fair value of our common stock were as follows:
| • | external market and economic conditions affecting the medical device industry; |
| • | prices at which we sold shares of our convertible preferred stock to third-party investors; |
| • | the superior rights and preferences of securities senior to our common stock, such as our preferred stock, at the time of each grant; |
| • | our need for future financing to fund commercial operations; |
| • | the lack of marketability of our common stock; |
| • | third-party valuations of our common stock; |
| • | our historical operating and financial performance; |
| • | the status of our research and development efforts; |
| • | the status of our new product releases to the spine market; |
| • | the likelihood of achieving a liquidity event, such as an initial public offering or sale of our company; and |
| • | estimates and analysis provided by management. |
We have regularly obtained third-party valuations to assist our board of directors in determining the fair value of our common stock for each stock option grant and other stock-based awards, on an annual basis since 2007.
Significant Factors and Assumptions Used in Determining Fair Value of Common Stock
For the periods presented, valuations of our common stock were determined in accordance with the guidelines outlined in the American Institute of Certified Public Accountants Practice Aid, Valuation of Privately-Held-Company Equity Securities Issued as Compensation.
The significant assumptions used in determining the estimated fair value of our common shares are updated on an annual basis and include the following:
| As of and for the year ended December 31, | ||||||||
| Valuation technique |
2011 | 2012 | ||||||
| Hybrid of discounted cash flow method and guideline public company methodology |
Hybrid of discounted cash flow method and guideline public company methodology |
|||||||
| Weighted-average cost of capital (WACC) |
18 | % | 17 | % | ||||
| Revenue growth rate (range) |
159.4% to 5.7 | % | 32.5% to 5.0 | % | ||||
| Compounded average revenue growth rate |
17.5 | % | 17.7 | % | ||||
| EBITDA margin (range) |
(25.0)% to 28.8 | % | (23.8)% to 32.7 | % | ||||
The two components of our hybrid model are the income approach, which is a discounted cash flow method, and the market approach, which is a guideline public company method. We weighted the results of these two methods as follows: discounted cash flow method was weighed 60% and the guideline public company method was weighed 40%. We selected these two component methods due to their applicability to private companies and weighted each method based on the likelihood we would complete a public offering at the time of the valuation.
62
A discussion of the determination of the fair value of our common stock on our option grant dates from January 1, 2011 to June 19, 2012 is provided below:
January 1, 2011 through June 16, 2011
From January 1, 2011 through June 16, 2011, our board of directors granted options to purchase an aggregate of 9,354 shares of our common stock all with an exercise price of $25.77 per share. In estimating the fair value of our common stock to set the exercise price of such options as of each date of grant in this period, our board of directors reviewed and considered an independent valuation report for our common stock as of September 30, 2010 delivered to us in December 2010, which reflected a fair value for our common stock of $25.52 per share. On each grant date, our board of directors considered whether changes in the business or other circumstances had impacted the analysis and assumptions associated with the September 2010 third-party valuation. In particular, our board of directors noted that we had just closed the acquisition of US Spine on September 20, 2010 which influenced the September 2010 valuation. The board of directors also noted that a long-term liquidity event, including a private sale, merger or acquisition, was our most likely liquidity scenario on each grant date. As a result of these analyses, the board of directors determined the fair value of our common stock on January 1, 2011, March 3, 2011 and June 16, 2011 was $25.77 per share consistent with the valuation as of September 30, 2010. In granting options at $25.77 per share, the primary valuation factors considered by our board of directors on each grant date were:
| • | the independent third-party valuation as of September 30, 2010; |
| • | the continued growth of our business and revenues and anticipated increase in growth resulting from the acquisition of US Spine; |
| • | the fact that we continued to operate at a loss, partially as a result of our continued investment in research and development and our sales organization; |
| • | a discount rate, based on our estimated weighted average cost of capital; |
| • | a lack of marketability discount; |
| • | the exit value multiples set by our comparable companies; and |
| • | management’s expectation that we would achieve forecasted revenue for the year ended December 31, 2011. |
December 8, 2011 through June 19, 2012
From December 8, 2011 through June 19, 2012, our board of directors granted options to purchase an aggregate of 129,306 shares of our common stock all with an exercise price of $25.77 per share. In estimating the fair value of our common stock to set the exercise price of such options as of each date of grant in this period, our board of directors reviewed and considered an independent valuation report for our common stock as of September 30, 2011 delivered to us in October 2011, which reflected a fair value for our common stock of $24.49 per share. On each grant date, our board of directors considered whether changes in the business or other circumstances had impacted the analysis and assumptions associated with the September 2011 third-party valuation. In particular, the board of directors noted that we had begun to assimilate the US Spine products and acquired technology and to operate our business in the ordinary course, and that a long-term liquidity event, including a private sale, merger or acquisition, was still our most likely liquidity scenario on each grant date. As a result, the board of directors determined that the fair value of our common stock remained unchanged from the previous determinations and was $25.77 per share on the dates of the option grants in December 2011, March 2012 and June 2012. The board of directors also noted on each grant date that the $25.77 per share valuation determination was higher than the value reflected in the September 2011 third-party valuation. In granting options at $25.77 per share, the primary valuation factors considered by our board of directors on each grant date were:
| • | the independent third-party valuation as of September 30, 2011; |
| • | the continued growth of our business and revenues; |
| • | the fact that we continued to operate at a loss, partially as a result of our continued investment in research and development and our sales organization; |
| • | a discount rate, based on our estimated weighted average cost of capital; |
| • | a lack of marketability discount; |
| • | the exit value multiples set by our comparable companies; and |
| • | management’s expectation that we would achieve forecasted revenue for the year ended December 31, 2012. |
63
On March 15, 2012, the board of directors, in an effort to incentivize employees, approved the cancellation of all stock option grants to current employees and board members issued with exercise prices greater than $25.77 per share. The board of directors approved new grants for the same number of options to current employees and directors with an exercise price of $25.77 per share, immediate vesting, and which all expire in March 2022 or upon termination of employment.
Stock-Based Compensation
We apply the fair value recognition provisions of Financial Accounting Standards Board, or FASB, Accounting Standards Codification, or ASC, Topic 718, Compensation-Stock Compensation, or ASC 718. Determining the amount of stock-based compensation to be recorded requires us to develop estimates of the fair value of stock options and other equity awards as of their grant date. Stock-based compensation expense is recognized ratably over the requisite service period, which in most cases is the vesting period of the award. Calculating the fair value of stock-based awards requires that we make highly subjective assumptions. Use of this valuation methodology requires that we make assumptions as to the volatility of our common stock, the expected term of our stock options, the risk free rate of return for a period that approximates the expected term of our stock options and our expected dividend yield. Because we are a privately-held company with no trading history, we utilize the historical stock price volatility from a representative group of public companies to estimate expected stock price volatility. We selected companies from the medical device industry, specifically those who are focused on the design, development and commercialization of products for the treatment of spine disorders, and who have similar characteristics to us, such as stage of life cycle and size. We intend to continue to utilize the historical volatility of the same or similar public companies to estimate expected volatility until a sufficient amount of historical information regarding the price of our publically traded stock becomes available. We use the simplified method as prescribed by the Securities and Exchange Commission Staff Accounting Bulletin No. 107, Share-based Payment, to calculate the expected term of stock option grants to employees as we do not have sufficient historical exercise data to provide a reasonable basis upon which to estimate the expected term of stock options granted to employees. We utilize a dividend yield of zero because we have never paid cash dividends and have no current intention to pay cash dividends. The risk-free rate of return used for each grant is based on the U.S. Treasury yield curve in effect at the time of grant for instruments with a similar expected life. We estimated the fair value of options granted using a Black-Scholes-Merton option pricing model with the following assumptions:
| Year ended December 31, |
Nine Months Ended
September 30, |
|||||||||||||||
| 2011 | 2012 | 2012 | 2013 | |||||||||||||
| Weighted-average risk-free interest rate |
1.32 | 1.14 | 1.14 | * | ||||||||||||
| Weighted-average expected life (in years) |
6.30 | 5.34 | 5.34 | * | ||||||||||||
| Expected dividend yield |
0 | % | 0 | % | 0 | % | * | |||||||||
| Weighted-average expected volatility |
70 | % | 72 | % | 72 | % | * | |||||||||
| Weighted-average fair value of options granted |
$ | 16.50 | $ | 14.18 | $ | 14.18 | * | |||||||||
| * | There were no stock option grants in the nine months ended September 30, 2013. |
The estimated fair value of stock-based awards for employee and non-employee director services are expensed over the requisite service period. Option awards issued to non-employees, excluding non-employee directors, are recorded at their fair value as determined in accordance with authoritative guidance, are periodically revalued as the options vest and are recognized as expense over the related service period. As a result, the charge to operations for non-employee awards with vesting conditions is affected each reporting period by changes in the fair value of our common stock.
Stock-based compensation expense associated with stock options granted to employees totaled $0.8 million, $1.0 million, $0.8 million and $0.2 million for fiscal years 2011 and 2012, and the nine months ended September 30, 2012 and 2013, respectively. As of September 30, 2013, we had approximately $383,000 of total unrecognized stock-based compensation expense, which we expect to recognize over a weighted-average remaining vesting period of approximately 1.96 years. While our stock-based compensation for stock options
64
granted to employees to date has not been material to our financial results, we expect the impact to grow in future periods due to the issuance of RSUs in 2013 and 2014 for which no expense has been recorded to date, and the potential increases in the value of our common stock and headcount.
We are required to estimate the level of forfeitures expected to occur and record stock-based compensation expense only for those awards that we ultimately expect will vest. We estimate our forfeiture rate based on the type of award, employee class and historical experience. Through September 30, 2013, actual forfeitures have not been material.
In February 2013, our employees elected to exchange 93,968 options to purchase our common stock for restricted stock units, or RSUs, pursuant to a one-time tender offer authorized by our board of directors. The RSUs were issued under the 2012 Plan and have three-year terms and vest upon the earlier of a change in control or expiration of the lock-up period for our initial public offering. The fair value that will be recognized when vesting conditions for these RSUs are satisfied is expected to be approximately $1.7 million.
The following table sets forth information with respect to stock options granted to employees and directors from January 1, 2011 through February 12, 2014:
| Date |
Number of Options Granted |
Exercise Price Per Share |
Common Stock Fair Value per Share at Grant Date |
|||||||||
| 1/1/2011 |
582 | $ | 25.77 | $ | 25.77 | |||||||
| 3/3/2011 |
1,207 | $ | 25.77 | $ | 25.77 | |||||||
| 6/16/2011 |
7,566 | $ | 25.77 | $ | 25.77 | |||||||
| 12/8/2011 |
38,856 | $ | 25.77 | $ | 25.77 | |||||||
| 3/15/2012 |
88,355 | $ | 25.77 | $ | 25.77 | |||||||
| 6/19/2012 |
2,095 | $ | 25.77 | $ | 25.77 | |||||||
| 11/27/2013 |
9,310 | $ | 17.53 | $ | 17.53 | |||||||
| 12/24/2013 |
3,879 | $ | 17.53 | $ | 17.53 | |||||||
There was no intrinsic value for outstanding options as of September 30, 2013, based on the initial public offering price of $5.75 per share. At September 30, 2013, we had 123,660 RSUs outstanding that will vest upon the earlier of a change in control or expiration of the lock-up period for our initial public offering. We granted an aggregate of 64,530 RSUs after September 30, 2013, all of which are outstanding. Of these additional RSUs, 58,197 RSUs held by Mr. Moyes will vest according to Mr. Moyes’s employment arrangement (see “Executive and Director Compensation—2013 Compensation”) and the remainder will vest upon the earlier of a change in control or the expiration of the lock-up period for our initial public offering. In addition on January 27, 2014, our board approved grants totaling 1,405,902 RSUs to be issued on effectiveness of the filing of a registration statement on Form S-8. We will take compensation charges upon vesting of RSUs based upon their grant date fair value. The aggregate fair market value to be recognized as compensation expense when vesting conditions for these RSUs are satisfied is expected to be approximately $2.8 million, including the $1.7 million expense as a result of the exchange described above.
Common Stock Warrant Liability and Preferred Stock Warrant Liability
As of September 30, 2013, we had warrants outstanding to purchase shares of our Series C, Series D, Series E and Series F convertible preferred stock and common stock. Freestanding warrants that are related to the purchase of redeemable preferred stock are classified as liabilities and recorded at fair value regardless of the timing of the redemption feature or the redemption price or the likelihood of redemption. The warrants are subject to re-measurement at each balance sheet date and any change in fair value is recognized as a component of other income (expense), net in our statement of comprehensive loss. We measure the fair value of our warrants to purchase our convertible preferred stock using a Black-Scholes-Merton option pricing model. The warrants to purchase shares of our common stock contain a provision requiring a reduction to the exercise price in the event we issue common stock, or securities convertible into or exercisable for common stock, at a price per share lower than the warrant exercise price. The anti-dilution feature requires the warrants to be classified as liabilities and
65
re-measured at fair value at each balance sheet date. The fair value of the warrants to purchase common stock on the date of issuance and on each re-measurement date is classified as a liability and is estimated using the Black-Scholes-Merton valuation model. Any modifications to the warrant liabilities are recorded in earnings during the period of the modification. The significant assumptions used in estimating the fair value of our warrant liabilities include the exercise price, volatility of the stock underlying the warrant, risk-free interest rate, estimated fair value of the stock underlying the warrant, and the estimated life of the warrant.
The consummation of this offering will result in the conversion of all classes of our convertible preferred stock into common stock. Upon such conversion of the underlying classes of convertible preferred stock, pursuant to the terms of the preferred stock warrants, the remaining warrants to purchase our Series C, Series D, Series E and Series F convertible preferred stock will be classified as a component of equity and no longer be subject to re-measurement. However, the common stock warrant liability will continue to be required to be re-measured at each balance sheet date, until such time that the common stock warrants are exercised or expire.
Recently Issued Accounting Pronouncements
In February 2013, the FASB issued an update to improve the transparency of reporting reclassifications out of accumulated other comprehensive income. The amendments in the update did not change the current requirements for reporting net income or other comprehensive income in financial statements. The new amendments require an organization to present (either on the face of the statement where net income is presented or in the notes) the effects on the line items of net income of significant amounts reclassified out of accumulated other comprehensive income if the item reclassified is required under generally accepted accounting principles in the United States, or U.S. GAAP, to be reclassified to net income in its entirety in the same reporting period. Additionally, for other amounts that are not required under U.S. GAAP to be reclassified in their entirety to net income in the same reporting period, an entity is required to cross-reference other disclosures required under U.S. GAAP to provide additional detail about those amounts. The amendments are effective for reporting periods beginning after December 15, 2012. We do not expect that the adoption of this guidance will have a material impact on the consolidated financial statements.
Jumpstart Our Business Startups Act of 2012
On April 5, 2012, the Jumpstart Our Business Startups Act of 2012, or JOBS Act, was enacted. Section 107 of the JOBS Act, provides that an “emerging growth company” can take advantage of the extended transition period provided in Section 7(a)(2)(B) of the Securities Act of 1933, as amended, for complying with new or revised accounting standards. In other words, an “emerging growth company” can delay the adoption of certain accounting standards until those standards would otherwise apply to private companies. We are electing to delay such adoption of new or revised accounting standards, and as a result, we may not comply with new or revised accounting standards on the relevant dates on which adoption of such standards is required for non-emerging growth companies. As a result of this election, our financial statements may not be comparable to the financial statements of other public companies. We may take advantage of these reporting exemptions until we are no longer an “emerging growth company.
We are in the process of evaluating the benefits of relying on other exemptions and reduced reporting requirements provided by the JOBS Act. Subject to certain conditions set forth in the JOBS Act, as an “emerging growth company,” we intend to rely on certain of these exemptions, including without limitation, (1) providing an auditor’s attestation report on our system of internal controls over financial reporting pursuant to Section 404(b) of the Sarbanes-Oxley Act and (2) complying with any requirement that may be adopted by the Public Company Accounting Oversight Board regarding mandatory audit firm rotation or a supplement to the auditor’s report providing additional information about the audit and the consolidated financial statements, known as the auditor discussion and analysis. We may be able to remain an “emerging growth company” until the earliest of (a) the last day of the fiscal year in which we have total annual gross revenues of $1 billion or more, (b) the last day of our fiscal year following the fifth anniversary of the date of the completion of this offering, (c) the date on which we have issued more than $1 billion in non-convertible debt during the previous three years or (d) the date on which we are deemed to be a large accelerated filer under the rules of the SEC.
66
Quantitative and Qualitative Disclosures About Market Risk
We are exposed to market risk in the ordinary course of our business. We do not hold or issue financial instruments for trading purposes. Market risk represents the risk of loss that may impact our financial position due to adverse changes in financial market prices and rates. Our market exposure is primarily a result of fluctuations in interest rates, however, we do not believe there is material exposure to interest rate risk. We also do not believe we are exposed to material risk resulting from fluctuations in foreign currency exchange rates due to the level of our international sales.
Controls and Procedures
Internal control over financial reporting is a process designed to provide reasonable assurance regarding the reliability of financial reporting and the preparation of financial statements in accordance with U.S. GAAP. We are currently in the process of reviewing, documenting and testing our internal control over financial reporting. We have not performed an evaluation of our internal control over financial reporting, such as required by Section 404 of the Sarbanes-Oxley Act, nor have we engaged an independent registered public accounting firm to perform an audit of our internal control over financial reporting as of any balance sheet date or for any period reported in our financial statements. Presently, we are not an accelerated filer, as such term is defined by Rule 12b-2 of the Securities Exchange Act of 1934, as amended, and therefore, our management is not presently required to perform an annual assessment of the effectiveness of our internal control over financial reporting. This requirement will first apply to our Annual Report on Form 10-K for the year ending December 31, 2014. Our independent public registered accounting firm will first be required to attest to the effectiveness of our internal control over financial reporting for our Annual Report on Form 10-K for the first year we are no longer an “emerging growth company” under the JOBS Act. However, in connection with our audit for the year ended December 31, 2012 and the review of our interim financial statements, our independent registered public accounting firm noted four material weaknesses and one significant deficiency in our internal control over financial reporting. See “Risk Factors—Our internal control over financial reporting does not currently meet the standards required by Section 404 in the Sarbanes-Oxley Act, and failure to achieve and maintain effective internal control over financial reporting in accordance with Section 404 of the Sarbanes-Oxley Act could result in material misstatements of our annual or interim financial statements and have a material adverse effect on our business and share price,” for a discussion of these matters.
67
Overview
We are a commercial biomaterial company focused on using our silicon nitride technology platform to develop, manufacture and sell a broad range of medical devices. We currently market spinal fusion products and are developing products for use in total hip and knee joint replacements. We believe our silicon nitride, an advanced ceramic, technology platform enables us to offer new and transformative products in the orthopedic and other medical device markets. We believe we are the first and only company to use silicon nitride in medical applications and over 14,000 of our silicon nitride spine products have been implanted in patients.
Biomaterials are synthetic or natural materials available in a variety of forms that are used in virtually every medical specialty. We believe our silicon nitride biomaterial has superior characteristics compared to commonly used biomaterials in the markets we are targeting, including polyetheretherketone, or PEEK, which is the most common biomaterial used for interbody spinal fusion products. Specifically, we believe our silicon nitride has the following key attributes: promotion of bone growth; hardness, strength and resistance to fracture; resistance to wear; non-corrosive; anti-infective properties; and superior diagnostic imaging compatibility.
We produce our silicon nitride advanced ceramic in four forms: (1) a fully dense, load-bearing solid, referred to as MC2; (2) a porous bone-like cancellous structured form, referred to as CSC; (3) a composite incorporating both our solid MC2 material and our porous CSC material intended to promote an ideal environment for bone growth; and (4) a coating for application onto other biomaterials. This capability provides us with the ability to utilize our silicon nitride in distinct ways depending on its intended application, which, together with our silicon nitride’s key characteristics, distinguishes us from manufacturers of other biomaterials and our products from products using other biomaterials.
According to iData Research, Inc., or iData, in 2012, the markets for spinal implants in the United States and in combined major European markets were $5.2 billion and $1.0 billion, respectively. Interbody spinal fusions accounted for over $1.2 billion and $172.2 million of these markets, respectively. Additionally, Orthopedic Network News reported that the U.S. markets for the components of total hip and knee replacement product candidates that we are initially developing were $455.0 million and $1.5 billion, respectively.
We currently market our Valeo MC2 silicon nitride interbody spinal fusion devices in the United States and Europe for use in the cervical and thoracolumbar areas of the spine. We believe our Valeo devices have a number of advantages over existing products due to silicon nitride’s key characteristics, resulting in faster and more effective fusion and reduced risk of infection. Our first generation Valeo silicon nitride device received 510(k) regulatory clearance and a CE Mark in 2008. Based on surgeon feedback, we developed a second generation of Valeo products with design enhancements that improve surgeon control during implantation and stability post procedure. Earlier this year, we initiated a targeted launch of our second generation Valeo interbody fusion devices and expect to complete the full launch in the first half of 2014. We also market our Valeo composite interbody spinal fusion device made from both our solid MC2 and porous CSC silicon nitride in the Netherlands, Spain and Germany. This device may reduce or eliminate the need for allograft bone, which is taken from human cadavers, and other biomaterials to act as a scaffold to support bone growth as part of the surgical procedure. We are currently conducting a prospective clinical trial in Europe, named CASCADE, comparing our Valeo composite silicon nitride interbody devices to PEEK interbody devices to obtain additional data to support 510(k) clearance of this product in the United States. The trial is 100% enrolled. We expect results to be available in the second half of 2014. If this trial is successful, we plan to file a 510(k) submission with the U.S. Food and Drug Administration, or FDA, by mid-2015. In addition, in the first half of 2013, we initiated a Design and Build Program focused on collaborating with influential surgeons to develop customized silicon nitride spinal fusion products and instruments and the first products designed under this program were sold in the third quarter of 2013. To date, the rate of adverse events reported to the FDA for our implanted Valeo interbody spinal fusion devices is 0.1%.
In addition to our silicon nitride-based spinal fusion products, we market a complementary line of non-silicon nitride spinal fusion products which allows us to provide surgeons and hospitals with a broader range of products.
68
These products include three lines of spinal fusion devices and five types of orthobiologics, which are used by surgeons to help promote bone growth and fusion in spinal fusion procedures. Although our non-silicon nitride products have accounted for approximately 70% or more of our product revenues for the years ended December 31, 2012 and 2011 and the nine months ended September 30, 2013, we believe the continued promotion and potential for adoption of our silicon nitride products and product candidates, if approved, provides us the greatest opportunity to grow our business in new and existing markets and achieve our goal to become a leading biomaterial company.
We are also incorporating our silicon nitride technology into components for use in total hip and knee replacement product candidates that we are, or plan on, developing in collaboration with a strategic partner. If approved by the FDA, we believe that our silicon nitride total hip and knee product candidates will provide competitive advantages over current products made with traditional biomaterials. We also believe our silicon nitride technology platform can be used for developing products in other markets and have developed prototypes for use in the dental, sports medicine and trauma markets. In addition, as a result of some of the key characteristics of our silicon nitride, including the promotion of bone growth, resistance to wear, non-corrosiveness and anti-infective properties, we believe our silicon nitride coating may be used to enhance our metal products as well as commercially available metal spinal fusion, joint replacement and other medical products.
We have recently put in place a senior management team with over 150 years of collective experience in the healthcare industry. Members of our management team have experience in product development, launching new products into the orthopedics market and selling to hospitals through direct sales organizations, distributors, manufacturers and other companies in the orthopedic space. We operate a 30,000 square foot manufacturing facility located at our corporate headquarters in Salt Lake City, Utah, and we are the only vertically integrated silicon nitride orthopedic medical device manufacturer in the world. We market and sell our products to surgeons and hospitals in the United States and select markets in Europe and South America through our established network of more than 50 independent sales distributors who are managed by our in-house sales and marketing management team.
Biomaterials
Biomaterials are synthetic or natural biocompatible materials that are used in virtually every medical specialty to improve or preserve body functionality. Various types of biomaterials are used as essential components in medical devices, drug delivery systems, replacement and tissue repair technologies, prostheses and diagnostic technologies.
There are four general categories of biomaterials:
| • | Metals. Metals commonly used as biomaterials include titanium, stainless steel, cobalt, chrome, gold, silver and platinum, and alloys of these metals. Examples of medical uses of metals include the repair or stabilization of fractured bones, stents, surgical instruments, bone and joint replacements, spinal fusion devices, dental implants and restorations and heart valves. According to MarketsandMarkets, a global market research firm, metals represented approximately 31% of the worldwide sales of all biomaterials in 2012. |
| • | Polymers. Polymers are synthetic compounds consisting of similar molecules linked together that can be created to have specific properties. Polymers commonly used as biomaterials include nylon, silicon rubber, polyester, polyethylene, cross-linked polyethylene (a stronger version), polymethylmethacrylate, polyvinyl chloride and polyetheretherketone, which is commonly referred to as PEEK. Examples of medical uses of polymers include soft-tissue replacement, sutures, drug delivery systems, joint replacements, spinal fusion devices and dental restorations. Polymers represented approximately 29% of the worldwide sales of all biomaterials in 2012. |
| • | Ceramics. Ceramics are hard, non-metallic, non-corrosive, heat-resistant materials made by shaping and then applying high temperatures. Traditional ceramics commonly used as biomaterials include carbon, oxides of aluminum, zirconium and titanium, calcium phosphate and zirconia-toughened alumina. Examples of medical uses of ceramics include repair, augmentation or stabilization of fractured bones, bone and joint |
69
| replacements, spinal fusion devices, dental implants and restorations, heart valves and surgical instruments. Ceramics represented approximately 26% of the worldwide sales of all biomaterials in 2012. |
| • | Natural biomaterials. Natural biomaterials are derived from human donors, animal or plant sources and include human bone, collagen, gelatin, cellulose, chitin, alginate and hyaluronic acid. Examples of medical uses of natural biomaterials include the addition or substitution of hard and soft tissue, cornea protectors, vascular grafts, repair and replacement of tendons and ligaments, bone and joint replacements, spinal fusion devices, dental restorations and heart valves. Natural biomaterials represented approximately 14% of the worldwide sales of all biomaterials in 2012. |
According to MarketsandMarkets, orthopedics accounted for approximately $15.0 billion, or 34%, of the $44.0 billion total biomaterials market in 2012. Within orthopedics, biomaterials are extensively used in spinal fusion procedures, hip and knee replacements and the repair or stabilization of fractured bones.
Market Opportunity
Overview
We believe our silicon nitride technology platform provides us with numerous competitive advantages in the orthopedic biomaterials market. We market interbody spinal fusion devices and related products and are developing products for use as components in total hip and knee joint replacements. We believe we can also utilize our silicon nitride technology platform to develop future products in additional markets, such as the dental, sports medicine and trauma markets.
According to iData, in 2012, the markets for spinal implants in the United States and in combined major European markets were $5.3 billion and $1.0 billion, respectively. Interbody spinal fusion products accounted for over $1.2 billion and $172.2 million of these markets, respectively. In 2012, there were approximately 300,000 interbody spinal fusion procedures conducted in the United States, of which the significant majority utilized interbody devices comprised of PEEK and bone, with occasional use of metals and other materials including ceramics. The market for interbody spinal fusion devices has shifted over time as new biomaterials with superior characteristics have been incorporated into these devices and have launched into the market. For example, in the 1990s, metals quickly penetrated the interbody spinal fusion market because of the limitations of devices available at that time made from allograft bone and, more recently, products made of PEEK rapidly penetrated the market because of the limitations of devices available at that time made from metal or allograft bone. Similarly, we believe our silicon nitride interbody spinal fusion products address the key limitations of other biomaterials currently used in interbody spinal fusion devices and demonstrate superior characteristics needed to improve clinical outcomes.
Additionally, Orthopedic Network News reported that the U.S. markets for total hip and knee replacements in 2012 were $2.7 billion and $4.0 billion, respectively. According to Orthopedic Network News, in 2012, there were more than 470,000 total hip replacement procedures and 734,000 total knee replacement procedures conducted in the United States. Orthopedic Network News also reported that in 2012, the U.S. markets for the components of total hip and knee replacement product candidates that we are initially developing were $455.0 million and $1.5 billion, respectively. The combinations of biomaterials most commonly used in joint replacement implants are metal-on-cross-linked polyethylene and traditional ceramic-on-cross-linked polyethylene.
We believe that the main drivers for the growth of the orthopedic biomaterials market, and, in particular, the spinal fusion and joint replacement markets, are the following:
| • | Favorable and Changing Demographics. With the growing number of elderly people, age-related ailments are expected to rise sharply, which we believe will increase the demand and need for biomaterials and devices with improved performance capabilities. Also, middle-aged and older patients increasingly expect to enjoy active lifestyles, and consequently demand effective treatments for painful spine and joint conditions, including better performing and longer-lasting interbody spinal fusion devices and joint replacements. |
| • | Introduction of New Technologies. Better performing and longer-lasting biomaterials, improved diagnostics, and advances in surgical procedures allow for surgical intervention earlier in the continuum of care and |
70
| better outcomes for patients. We believe surgical options using better performing and longer-lasting biomaterials will gain acceptance among surgeons and younger patients and drive accelerated growth and increase the size of the spinal fusion and joint replacement markets. |
| • | Market Expansion into New Geographic Areas. MarketsandMarkets anticipates that demand for biomaterials and the associated medical devices will increase as the applications in which biomaterials are used are introduced to and become more widely accepted in underserved countries, such as China. |
The Interbody Spinal Fusion Market
The human spinal canal is made up of 33 interlocking bones, referred to as vertebrae, separated by 23 intervertebral discs comprised of a hard outer ring made of collagen with a soft inner core, that act as shock absorbers between vertebrae. Disorders of the spine can result from degenerative conditions, deformities and trauma or tumor-related damage. Spinal fusion is the standard of care used to treat most spinal disorders and typically involves the placement of an interbody device between vertebrae to reestablish spacing between vertebrae and alignment of the spine. Generally, the interbody device is stabilized by screws and, in some procedures, plates or rods. To enhance bone attachment, surgeons often pack the interbody device with a biomaterial that induces bone growth. Following successful treatment, new bone tissue grows in and around the interbody device over time, which helps fuse the vertebrae and create long-term stability of the interbody device, leading to the alleviation of pain and increase in mobility.
We selected this market as the first application for our silicon nitride technology because of its size, the limitations of currently available products and the key characteristics silicon nitride possesses which are critical for a superior interbody spinal fusion device.
| • | Promotion of Bone Growth. The biomaterial should be both osteoconductive and create an osteoinductive environment to promote bone growth in and around the interbody device to further support fusion and stability. Osteoconduction occurs when material serves as a scaffold to support the growth of new bone in and around the material. Osteoinduction involves the stimulation of osteoprogenitor cells to develop, or differentiate, into osteoblasts, which are cells that are needed for bone growth. |
| • | Strength and Resistance to Fracture. The biomaterial should be strong and resistant to fracture during implantation of the device and to successfully restore intervertebral disc space and spinal alignment during the fusion process. The biomaterial should have high flexural strength, which is the ability to resist breakage during bending, and high compressive strength, which is the ability to resist compression under pressure, to withstand the static and dynamic forces exerted on the spine during daily activities over the long term. |
| • | Anti-Infective. Spinal fusion devices can become colonized with bacteria, which may limit fusion to adjacent vertebrae or cause serious infection. Treating device-related infection is costly and generally requires repeat surgery, including surgery to replace the device, referred to as revision surgery, which may extend hospital stays, suffering and disability for patients. A biomaterial that has anti-infective properties can reduce the incidence of bacteria colonization in and around the interbody device that can lead to infection, revision surgery and associated increased costs. Publicly available articles report infection rates following implantation of traditional spinal fusion devices ranging from 3% to 18%. |
| • | Imaging Compatibility. The biomaterial should be visible through, and not inhibit the effective use of, common surgical and diagnostic imaging techniques, such as x-ray, CT and MRI. These imaging techniques are used by surgeons during and after spinal fusion procedures to assist in the proper placement of interbody devices and to assess the quality of post-operative bone fusion. |
Limitations of Biomaterials used in Interbody Spinal Fusion Devices
The three biomaterials most commonly used in interbody spinal fusion devices are PEEK, human cadaver bone, also referred to as allograft bone, and metals. We believe these materials do not possess the key characteristics required to form the optimal interbody spinal fusion device and are susceptible to potential fracture, implant-related infection, pain, limited fusion and instability, which have resulted in revision surgeries.
71
PEEK (polyetheretherketone)
PEEK is the most frequently used biomaterial for interbody spinal fusion devices and accounted for almost half of the devices implanted in the United States in 2012. We believe that the rate of revision surgery for PEEK interbody spinal fusion devices is approximately 6%. We believe this is caused by the following limitations of PEEK:
| • | Restricts Bone Growth. Due to PEEK’s hydrophobic nature, the human body may recognize PEEK as a foreign substance and, therefore, may encapsulate the device with fibrous tissue. Although it is still possible for bone to grow through the device, bone may not adhere to the surface of the device if this tissue develops. |
| • | Lacks Strength and Resistance to Fracture. PEEK lacks sufficient flexural strength, compressive strength and resistance to fracture necessary to reduce the risk of deformity or fracture during the fusion process. In addition, PEEK devices may fracture during implantation in certain interbody spinal fusion procedures. For example, in December 2012, Zimmer Spine recalled its PEEK Ardis® Interbody System Inserter, a surgical instrument used to implant a PEEK interbody spinal fusion device, because it resulted in the PEEK implants being susceptible to breakage when too much lateral force was applied to the inserter during implantation. |
| • | Lacks Anti-Infective Properties. PEEK does not have any inherent anti-infective properties. In fact, a biofilm may form around a PEEK device that allows the colonization of bacteria, which can lead to infection. |
| • | Lacks Imaging Compatibility. PEEK is invisible on x-rays. As a result, manufacturers of PEEK devices add metal markers to their devices so surgeons can see the location of the devices by x-ray. These markers, however, do not show the full outline of the device, which makes it difficult to assess the accuracy of the placement of the device. In addition, the metal markers cause artifacts on CT and MRI that can compromise the quality of the image. |
Allograft Bone
Allograft bone is the second most frequently used biomaterial in interbody spinal fusion devices and accounted for over 40% of the devices implanted in the United States in 2012. Allograft bone has the following limitations:
| • | Limited Promotion of Bone Growth. Allograft bone has limited osteoinductive characteristics and therefore may not effectively promote bone growth in and around the interbody device. |
| • | Lacks Strength and Resistance to Fracture. Generally, allograft bone is not as strong as live bone within the body or other materials used in interbody devices. In addition, techniques used to sterilize allograft bone, like gamma irradiation, can cause the allograft to become brittle and more likely to fracture. |
| • | Lacks Anti-Infective Properties and Risk of Disease Transmission. In addition to not having inherent anti-infective properties, allograft bone exposes patients to a greater risk of disease transmission and auto-immune response. |
In addition, allograft bone is subject to inconsistent quality and size, which may require surgeons to make compromises on the fit of the device during surgery.
Metals
We believe metal interbody devices accounted for less than 10% of the devices implanted in the United States in 2012. Metals have the following limitations:
| • | Limited Promotion of Bone Growth. Metals have limited osteoinductive characteristics and therefore do not effectively promote bone growth in and around the interbody device. |
| • | Lack Anti-Infective Properties. Metals do not have inherent anti-infective properties and do not suppress the colonization of bacteria in and around the device which can lead to infection. |
| • | Lack Imaging Compatibility. Metals are opaque in x-rays and can cause significant imaging artifacts in CTs and MRIs. This can make it difficult for surgeons to detect the extent and quality of bone growth in and around the device in post-operative diagnostic imaging procedures. |
72
The Hip and Knee Joint Replacement Market
Total joint replacement involves removing the diseased or damaged joint and replacing it with an artificial implant consisting of components made from several different types of biomaterials. The key components of a total hip implant include an artificial femoral head, consisting of a ball mounted on an artificial stem attached to the femur, and a liner, which is placed inside a cup affixed into the pelvic bone. The femoral head and liner move against each other to replicate natural motion in what is known as an articulating implant. Total knee replacement implants also use articulating components and are comprised of the following four main components: a femoral condyle, which is a specially shaped bearing that is affixed to the lower end of the femur; a tibial tray that is affixed to the upper end of the tibia; a tibial insert that is rigidly fixed to the tibial tray and serves as the surface against which the femoral condyle articulates; and a patella, or knee cap, which also articulates against the femoral condyle.
Implants for total hip and knee replacements are primarily differentiated by the biomaterials used in the components that articulate against one another. The combinations of biomaterials most commonly used in hip and knee replacement implants in the United States are metal-on-cross-linked polyethylene and traditional ceramic-on-cross-linked polyethylene. The use of hip replacement implants incorporating metal-on-metal and traditional ceramic-on-traditional ceramic biomaterials experienced a steep decline in the United States over the last several years due to their significant limitations. We believe that the most common currently used biomaterials in joint replacement implants also have limitations, and do not possess all of the following key characteristics required for optimal total joint replacement implants:
| • | Resistance to Wear. The biomaterials should have sufficient hardness and toughness, as well as extremely smooth surfaces, to effectively resist wear. Because the articulating implants move against each other, they are subject to friction, which frequently lead to abrasive wear and the release of small wear particles. This may cause an inflammatory response which results in osteolysis, or bone loss. Surgeons have identified osteolysis as a leading cause of joint implant failure, resulting in the need for revision surgery to replace the failed implant. One of the most commonly used combinations of biomaterials, metal-on-cross-linked polyethylene, as well as metal-on-metal implants tend to generate a large number of metal wear particles, which can cause osteolysis and a moderate to severe allergic reaction to the metal, referred to as metal sensitivity. While less common, metal implants may also cause a serious condition called metallosis. Both metal sensitivity and metallosis can result in revision surgery. |
| • | Non-Corrosive. The biomaterials should be non-corrosive and should not cause adverse patient reactions. Metal placed in the human body corrodes over time and also results in the formation of metal ions, which leads to metal sensitivity in approximately 10% to 15% of the population and, less commonly, metallosis. As a result, there are significant increased risks from using metal-on-cross-linked polyethylene and metal-on-metal implants. |
| • | Hardness, Strength and Resistance to Fracture. The biomaterials should be hard, strong and resistant to fracture to adequately bear the significant loads placed on joints like the hip and knee during daily activities. We believe there are strength limitations associated with traditional ceramic-on-cross-linked polyethylene and traditional ceramic-on-traditional ceramic implants. |
| • | Anti-Infective. The biomaterials should have anti-infective properties to reduce the risk of bacteria colonization in and around the components that can lead to infection, revision surgeries and associated increased costs. Anti-infective properties reduce the risk of bacteria colonization in and around the components and reduce the likelihood of infection, revision surgeries and associated increased costs. None of the most commonly used biomaterials in joint replacement implants have anti-infective properties. |
Our Silicon Nitride Technology Platform
We believe we are the first and only company to use silicon nitride in medical applications. Silicon nitride is a chemical compound comprised of the elements silicon and nitrogen, with the chemical formula Si3N4. Silicon nitride, an advanced ceramic, is lightweight, resistant to fracture and strong, and is used in many demanding mechanical, thermal and wear applications, such as in space shuttle bearings, jet engine components and body armor.
73
We believe our silicon nitride is ideally suited for use in many medical applications and has the following characteristics that make it superior to other biomaterials, including PEEK, bone, metal and traditional ceramics, which do not possess all of these characteristics:
| • | Promotes Bone Growth. Our silicon nitride is osteoconductive through its inherent surface topography that provides support for new bone growth. We also believe our silicon nitride promotes an ideal environment for osteoinduction. As a hydrophilic material, silicon nitride attracts protein cells and nutrients that stimulate osteoprogenitor cells to differentiate into osteoblasts, which are needed for bone growth. Our silicon nitride also has an inherent surface chemistry that is more similar to bone than PEEK and metals are. As a result, we believe our silicon nitride has superior osteoconductive and osteoinductive properties when compared to other biomaterials, including those commonly used in interbody spinal fusion devices, such as PEEK, allograft bone and metal. These properties are highlighted in an in vivo study, where we measured the force required to separate devices from the spine after being implanted for three months, which indicates the level of osteointegration. In the absence of bacteria, the force required to separate our silicon nitride from its surrounding bone was approximately three times that of PEEK, and nearly two times that of titanium. In the presence of bacteria, the force required to separate our silicon nitride from its surrounding bone was over five times that of titanium, while there was effectively no separation force required for PEEK, indicating essentially no osteointegration. |
| • | Hard, Strong and Resistant to Fracture. Our silicon nitride is hard, strong and possesses superior resistance to fracture over traditional ceramics and greater strength than polymers currently on the market. For example, our silicon nitride’s flexural strength is more than five times that of PEEK and our silicon nitride’s compressive strength is over twenty times that of PEEK. Unlike PEEK interbody spinal fusion devices, we believe our silicon nitride inbody spinal fusion devices can withstand the forces exerted during implantation and daily activities over the long term. |
| • | Anti-Infective. We have demonstrated in in vitro and in vivo studies that silicon nitride has inherent anti-infective properties, which reduce the risk of infection in and around a silicon nitride device. PEEK, traditional ceramics, metals and bone do not have inherent anti-infective characteristics. These properties were highlighted in an in vitro study, where live bacteria counts were between 8 and 30 times lower on our silicon nitride than PEEK and up to 8 times lower on our silicon nitride than titanium. In addition to improving patient outcomes, we believe the anti-infective properties of our silicon nitride should make it an attractive biomaterial to hospitals and surgeons who are not reimbursed by third-party payors for the treatment of hospital-acquired infections. Additionally, silicon nitride is synthetic and, therefore, there is a lower risk of disease transmission through cross-contamination or of an adverse auto-immune response, sometimes associated with the use of allograft bone. |
| • | Imaging Compatible. Our silicon nitride interbody spinal fusion devices are semi-radiolucent and clearly visible in x-rays, and produce no distortion under MRI and no scattering under CT. These characteristics enable an exact view of the device for precise intra-operative placement and post-operative bone fusion assessment in spinal fusion procedures. We believe these qualities provide surgeons with greater certainty of outcomes with our silicon nitride devices than with other biomaterials, such as PEEK and metals. |
| • | Resistant to Wear. We believe our silicon nitride joint implant product candidates will have comparable or higher resistance to wear than metal-on-cross-linked polyethylene and traditional ceramic-on-cross-linked polyethylene joint implants, the two most commonly used total hip replacement implants. Also, debris associated with metal implants increases the risk of metal sensitivity and metallosis. Wear debris is a primary reason for early failures of metal and polymer articulating joint components. |
| • | Non-Corrosive. Our silicon nitride does not have the drawbacks associated with the corrosive nature of metal within the body, including metal sensitivity and metallosis, nor does it result in the release of metal ions into the body. As a result, we believe our silicon nitride products will have lower revision rates and fewer complications than comparable metal products. |
74
Our Forms of Silicon Nitride
The chemical composition of our in-house formulation of silicon nitride, processing and manufacturing experience allow us to produce silicon nitride in four distinct forms. This capability provides us with the ability to utilize our silicon nitride in a variety ways depending on its intended application, which, together with our silicon nitride’s key characteristics, distinguishes us from manufacturers of products using other biomaterials.
We currently produce silicon nitride for use in our commercial products and product candidates in the following forms:
| • | Solid Silicon Nitride, or MC2. This form of silicon nitride is a fully dense, load-bearing solid, and is used for devices that require high strength, toughness, fracture resistance and low wear, including for interbody spinal fusion devices, hip and knee replacement implants and dental implants. |
| • | Porous Silicon Nitride, or CSC. While this form of silicon nitride has a chemical composition that is identical to that of MC2, the CSC form of silicon nitride has a porous structure, which is engineered to mimic cancellous bone, the spongy like bone tissue that typically makes up the interior of human bones. Our porous silicon nitride has interconnected pores ranging in size between about 90 and 600 microns, which is similar to that of cancellous bone. This form of silicon nitride can be used for the promotion of bone in-growth and attachment. Our porous silicon nitride is used as a substitute for the orthobiologics currently used to fill interbody devices in an effort to stimulate fusion and as a bone void filler, and as a porous scaffold for medical devices. |

| • | Composite Silicon Nitride. This form of silicon nitride is a combination, or composite, of MC2 and CSC forms of silicon nitride. This composite may be used to manufacture devices and implants that mimic the structure of natural bone by incorporating both a fully dense, load-bearing solid MC2 component on the outside and a porous CSC component intended to promote bone in-growth on the inside. This composite form of silicon nitride is used in interbody spinal fusion devices and can be used in components for total hip and knee replacement implants. |
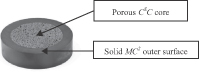
75
| • | Silicon Nitride Coating. With a similar chemical composition as our other forms of silicon nitride, this form of silicon nitride can be applied as an adherent coating to metallic substrates, including cobalt-chromium, titanium and steel alloys. We believe applying silicon nitride as a coating may provide a highly wear-resistant articulation surface, such as on femoral heads, which may reduce problems associated with metal or polymer wear debris. We also believe that the silicon nitride coating can be applied to devices that require firm fixation and functional connections between the device or implant and the surrounding tissue, such as hip stems and screws. The use of silicon nitride coating may also create an anti-infective barrier between the device and the adjacent bone or tissue. |

Our Competitive Strengths
We believe we can use our silicon nitride technology platform to become a leading biomaterial company and have the following principal strengths:
| • | Sole Provider of Silicon Nitride Medical Devices. We believe we are the only company that designs, develops, manufactures and sells medical grade silicon nitride-based products. Due to its key characteristics, we believe our silicon nitride enables us to offer new and transformative products across multiple medical specialties. In addition, with the FDA clearance of our silicon nitride Valeo products, we are one of only three companies that have developed and manufacture a ceramic for use in FDA cleared orthopedic medical devices in the United States. |
| • | In-House Manufacturing Capabilities. We operate a 30,000 square foot manufacturing facility located at our corporate headquarters in Salt Lake City, Utah. This operation complies with the FDA’s quality system regulation, or QSR, and is certified under the International Organization for Standardization’s, or ISO, standard 13485 for medical devices. This state-of-the-art facility allows us to rapidly design and produce silicon nitride products and control the entire manufacturing process from raw material to finished goods. We have also entered into a cooperative research and development agreement with Kyocera Industrial Ceramics Corporation, or Kyocera, under which we will work with Kyocera to determine its ability to become a second qualified manufacturer of our silicon nitride-based spinal fusion products and product candidates. |
| • | Established Commercial Infrastructure. We market and sell our products to surgeons and hospitals in the United States, and select markets in Europe and South America through our established network of more than 50 independent sales distributors who are managed by our experienced in-house sales and marketing management team. As a result, our product revenue is driven by end-user prices, unlike other biomaterial companies that sell their products at lower prices to OEMs who then sell their products to the end user. Our control over the sales and marketing processes also allows us greater flexibility to selectively collaborate with distributors when we believe their experience or geographic reach can be beneficial to us. |
| • | Portfolio of Non-Silicon Nitride Products. In addition to designing, developing, manufacturing and commercializing silicon nitride interbody spinal fusion devices, we sell a complementary line of non-silicon nitride spinal fusion products. We offer a full suite of spinal fusion products, which increases our access to surgeons and hospitals, and allows us to more effectively market our silicon nitride spinal fusion products to our customers. Product revenue from the sale of these non-silicon nitride products also supports further development of our silicon nitride products and product candidates. |
| • | Highly Experienced Management and Surgeon Advisory Team. We have recently assembled a senior management team with over 150 years of collective experience in the healthcare industry. Members of our management team have experience in product development, launching new products into the orthopedics |
76
| market and selling to hospitals through direct sales organizations, distributors, manufacturers and other orthopedic companies. We also collaborate with a network of leading surgeon advisors in the design and use of our products and product candidates. |
Our Strategy
Our goal is to become a leading biomaterial company focused on using our silicon nitride technology platform to develop, manufacture and commercialize a broad range of medical devices. Key elements of our strategy to achieve this goal are the following:
| • | Drive Further Adoption of our Silicon Nitride Interbody Spinal Fusion Devices. We believe that increasing the awareness of our silicon nitride technology by educating surgeons about its key benefits, and design improvements to our silicon nitride products and related instruments, will accelerate the adoption of our products and ultimately help improve patient outcomes. We continue to innovate with further design enhancements in the introduction of our second-generation interbody spinal fusion devices. We are currently selling this new line to select surgeons and expect to complete the full launch of the line in the United States in the first half of 2014. To drive further awareness of our products and the associated benefits offered by our silicon nitride technologies, we will continue to educate surgeons through multiple channels including industry conferences and meetings, media outlets and through our sales and marketing efforts. We also plan to facilitate the publication of data from bench testing and clinical outcome case studies. |
| • | Continue to Implement our Design and Build Program. In the first half of 2013, we initiated a commercialization strategy, referred to as our Design and Build Program, in which we collaborate with influential surgeons to develop customized silicon nitride spinal fusion products and instruments. We first sell these products for use by the designing surgeons and a team of evaluating surgeons for their review based on their individual preferences focused on ease of use of the product and instrumentation and patient outcomes as compared to the previous products and instruments used by the surgeon. After the enhanced products are sold and evaluated and, if accepted by these surgeons, we plan to introduce these products more broadly into the market. The first products designed under this program were sold for initial evaluation in 2013. |
| • | Enhance our Commercial Infrastructure. We expect to increase the productivity of our sales and marketing infrastructure to help us further penetrate the interbody spinal fusion market by continuing to engage experienced independent sales distributors with strong orthopedic surgeon relationships. For example, in October 2013, we entered into a new European sales agent agreement with K2M, Inc., one of the largest privately held spinal device companies in the world. We also periodically conduct programs to ensure that our distributors are knowledgeable about how the characteristics of our silicon nitride devices meet the demands of a range of spinal fusion procedures, and we regularly update our distributors about studies, test results, reviews and other developments that demonstrate the competitive advantages of our silicon nitride devices. We may also establish distribution collaborations in the United States and abroad when access to large or well-established sales and marketing organizations may help us gain access to new markets, increase sales in our existing markets, or accelerate market penetration for selected products. |
| • | Develop Silicon Nitride for Total Joint Components. We are incorporating our silicon nitride technology into silicon nitride-coated components for use in total hip and knee replacement product candidates that we plan on developing in collaboration with a strategic partner. We also have designs for solid silicon nitride components and we will make a decision in the future about whether to pursue the development of these components. In December 2013, we participated in a pre-submission meeting with the FDA to finalize the regulatory strategy for a 510(k) clearance of our silicon nitride-coated total joint components in the United States. The FDA reviewers confirmed that the regulatory pathway would be a standard 510(k) clearance with supporting biomechanical testing. In response, we intend to develop silicon nitride-coated metal joint replacement components and then, together with a strategic partner, initiate biomechanical testing with our silicon nitride-coated metal components for use in total hip and knee replacement procedures to support a 510(k) submission to the FDA. We intend to pursue clearance of a total hip replacement product first, and if clearance is obtained, we intend to commercially launch products for use in total hip replacement by the second half of 2015. |
77
| • | Apply our Silicon Nitride Technology Platform to Other Opportunities. Our silicon nitride technology platform is adaptable and we believe it may be used to develop products to address other significant opportunities, such as in the dental, sports medicine and trauma markets. We have manufactured prototypes of dental implants, sports medicine and trauma products, and we have developed a process to coat metals with our silicon nitride to enhance current medical devices and instruments. We plan to collaborate with other companies to develop and commercialize any future products in those areas or we may develop any one of them by ourselves if sufficient resources should become available. |
Our Products and Product Candidates
We currently market a family of silicon nitride interbody spinal fusion devices and other non-silicon nitride spinal fusion products for use in cervical and lumbar spinal fusion surgical procedures to treat patients who suffer from degenerative, diseased and traumatic spine conditions. We are also developing multiple silicon nitride components for use in our total hip and knee replacement product candidates.
Spinal Fusion Products and Product Candidates
Our Valeo Silicon Nitride Products and Product Candidates
Our first generation Valeo silicon nitride spinal fusion device received 510(k) regulatory clearance and a CE mark in 2008. Based on surgeon feedback, we developed a second generation of Valeo products. In 2012, we received 510(k) clearance to market this second generation family of Valeo interbody spinal fusion devices, and we launched them with a select number of surgeons in 2013. Our second generation Valeo interbody spinal fusion devices offer distinct improvements over the first generation. The instrumentation of the second generation devices allow for better control of the device during implantation. The device allows for improved stability and potentially improved fusion after implantation and is offered in a broader selection of sizes. We expect to complete the full launch of our second generation Valeo interbody spinal fusion devices in the United States in the first half of 2014.
Our current products are:
| Valeo Interbody Fusion Devices |
Generation | |
| AL: Anterior Lumbar |
1st and 2nd | |
| PL: Posterior Lumbar |
1st and 2nd | |
| OL: Oblique Lumbar |
1st and 2nd | |
| C: Cervical |
1st | |
| TL: Transformal Lumbar |
1st | |
| CORP: Corpectomy |
1st |
We are also in the process of finishing the development of a Valeo stand-alone anterior lumbar intervertebral fusion device made from our MC2 silicon nitride. The Valeo stand-alone product candidate, which incorporates fixation screws, will allow surgeons to perform less invasive procedures. We believe this may result in better patient outcomes compared to other spinal fusion procedures. We anticipate seeking 510(k) clearance for this product candidate in the first half of 2014, and, if cleared by the FDA, we anticipate launching our Valeo stand-alone product candidate in the United States in the second half of 2014.
78
In 2009, we received a CE Mark to commercialize our Valeo interbody spinal fusion devices made from our composite silicon nitride. The porous CSC center structure of these devices is designed to facilitate bone growth into the device, which we believe will allow surgeons to reduce or eliminate the use of allograft bone and other osteoconductive biomaterials. We are currently marketing these devices in the Netherlands, Spain and Germany. Additionally, we are conducting a prospective clinical trial in Europe, named CASCADE, comparing our Valeo composite silicon nitride interbody devices to PEEK interbody devices to obtain additional safety and efficacy data to support the 510(k) clearance in the United States. The trial is 100% enrolled. We expect results to be available in the second half of 2014. If this trial is successful, we plan to file a 510(k) submission with the FDA by mid-2015.
Valeo Composite (MC2 + C2C)
Our Non-Silicon Nitride Spinal Fusion Products
We sell a line of complementary non-silicon nitride spinal fusion products to provide surgeons and hospitals with a broader range of products. Product revenue from the sale of our non-silicon nitride spinal fusion products further supports development of our silicon nitride products and product candidates. We plan to enhance our metal spinal fusion products with a silicon nitride coating. The following table lists our marketed non-silicon nitride spinal products.
| CATEGORY | PRODUCT NAME | BIOMATERIAL | ||
| Facet Fixation System |
Facet Gun Max/Facet Bolt | Metal | ||
| Javelin: MIS Locking Facet System | ||||
| Lumbar Spine Fixation |
Preference Classic Spine System | Metal | ||
| Preference 2 Spine System | ||||
| Preference 2 Complex Spine System | ||||
|
Orthobiologics |
Preference Element Bone Graft Substitute | Allograft | ||
| BioDefense: Human Amnion Stem Cell Wound Covering Patch | ||||
| BioDlogics: Human Amnion Stem Cell Liquid Wound Covering | ||||
| Valeo BP: Synthetic Bone Putty | ||||
| PROCET: Facet Fusion Allograft Implant | ||||
| Interbody Spinal Fusion Device |
Phantom Plus PLIF/TLIF IBFD | PEEK | ||
| Phantom Plus Cervical Spacer |
79
Our Total Hip and Knee Joint Replacement Product Candidates
Our Total Hip Implant Product Candidates
We have developed two designs of femoral heads for use in our total hip replacement product candidates. Our first design is a silicon nitride-coated metal femoral head, for total joint replacement, which we plan to develop with a medical device partner. The second design is a femoral head that is made from our solid MC2 silicon nitride and we are collaborating with Orthopaedic Synergy, Inc. to develop a total hip replacement product candidate using this design. These femoral heads are expected to articulate against a cross-linked polyethylene liner, fixed into a metal acetabular cup. We intend to initially advance our process to develop silicon nitride-coated femoral heads and then, together with a strategic partner, initiate biomechanical testing with our silicon nitride-coated femoral head for use in total hip replacement procedures to support a 510(k) submission to the FDA. If clearance is obtained, we intend to commercially launch products for use in total hip replacement by the second half of 2015. Although we have designs for solid silicon nitride components, we have not yet determined if we will pursue the development of these components.
Our Total Knee Implant Product Candidates
We have developed two designs of femoral condyle components for use in our total knee replacement product
candidates. The first design utilizes our silicon nitride coating and we plan to partner with a medical device company to incorporate this design into a total knee replacement product candidate. The second design is made from our solid MC2 silicon nitride and we are collaborating with Orthopaedic Synergy Inc. to develop a total knee joint replacement for this design. The femoral condyle component will attach to the lower end of the femur. The femoral condyle is expected to articulate against a cross-linked polyethylene tibial insert that will attach to the tibial tray at the upper end of the tibia, which we expect will be made from metal. We have successfully made prototypes of both designs. We intend to develop silicon nitride-coated femoral condyle components and then, together with a strategic partner, initiate biomechanical testing with our components for use in knee replacement procedures to support a 510(k) submission to the FDA. If clearance is obtained we intend to commercialize our products for use in total knee replacement surgeries post-FDA clearance. Although we have designs for solid silicon nitride components, we have not yet determined if we will pursue the development of these components.
Other Product Opportunities
Our silicon nitride technology platform is adaptable and we believe it may be used to develop products to address other significant opportunities, such as in the dental, sports medicine and trauma markets.
We also believe our coating technology may be used to enhance our marketed metal products as well as other commercially available metal spinal fusion and joint replacement products. We have produced feasibility prototypes of dental implants, other components for use in total hip implants in addition to our total hip and knee implant product candidates discussed above, a suture anchor for sports medicine and prototypes of silicon nitride-coated plates for potential trauma applications. We have also developed a process to apply our silicon nitride as a coating on other biomaterials.
The FDA has not evaluated any of these potential products and we are not currently advancing the development of any of these product candidates. We plan to collaborate with medical device companies to complete the development of and commercialize any product candidates we advance in these areas or develop any one of them ourself if sufficient resources should become available. We do not intend to use the proceeds from this offering to develop any of these product candidates.
Supporting Data
We and a number of independent third parties have conducted extensive biocompatibility, biomechanical, in vivo and in vitro testing on our silicon nitride to establish its safety and efficacy in support of regulatory clearance of our biomaterial, products and product candidates. We have also completed additional testing of our silicon nitride products and product candidates. The results of this testing have been published in peer review publications. Additionally, we have initiated prospective randomized clinical trials in humans in vivo and in vitro to support and expand our understanding of our silicon nitride’s performance relative to other biomaterials and
80
medical devices. We believe our product development strategy is consistent with the manner in which other biomaterials have been successfully introduced into the market and adopted as the standard of care. Listed below is an overview of some of the key testing completed on our silicon nitride biomaterial, products and product candidates to date, as well as other information about our silicon nitride and other biomaterials.
Biocompatibility
Before our silicon nitride was first used in commercial products in 2008, we conducted a series of biocompatibility tests following the guidelines of the FDA and ISO and submitted the results to the FDA as part of the regulatory clearance process. These tests confirmed that our silicon nitride products meet required biocompatibility standards for human use.
Promotion of Bone Growth
In 2012, we conducted two separate studies at Brown University, the results of which suggest that the chemistry and inherent surface topography of our solid MC2 silicon nitride provides an optimal environment for bone growth onto and around the device.
The first study was a series of in vitro analyses of protein adsorption, or presence on the surface of the biomaterial, onto silicon nitride, PEEK and titanium. The results of this study indicated that adsorption of two key proteins necessary for bone growth (fibronectin and vitronectin) were up to eight times greater on our silicon nitride than on PEEK, and up to four times greater than on titanium. A third important protein (laminin) had up to two times greater adsorption on our silicon nitride than on PEEK, and up to two-and-one-half times greater adsorption than on titanium.
The second study was an in vivo investigation of the osteointegration characteristics of these same three biomaterials after they had been surgically implanted into the skulls of laboratory rats. This study included an examination of the effect of Staphylococcus epidermidis bacteria on osteointegration. At time intervals of up to three months after implantation of the biomaterial, the amount of new bone growth within the surgical site and in direct contact with the implanted biomaterial was evaluated. In the absence of bacteria, new bone formation within the surgical site surrounding our silicon nitride was approximately 69%, compared with 36% and 24% for titanium and PEEK, respectively. Similarly, bone in direct contact, or apposition, with our silicon nitride, titanium and PEEK was 59%, 19% and 8%, respectively. As is common, in the presence of bacteria, new bone formation within the surgical site was suppressed, but still significantly greater for our silicon nitride than for the other two biomaterials. Observed new bone growth within the surgical site surrounding our silicon nitride was 41%, compared with 26% and 21% for titanium and PEEK, respectively. At the implant interface, the bone apposition for our silicon nitride, titanium and PEEK was 23%, 9% and 5%, respectively. To further characterize the extent of osteointegration, the force needed to separate each implant from its surrounding bone was measured. A larger force needed to separate the implant is an indication of improved osteointegration. At three months after implantation, in the absence of bacteria, the force required to separate our silicon nitride from its surrounding bone was approximately three times that of PEEK, and nearly two times that of titanium. In the presence of bacteria, there was effectively no separation force required for PEEK, indicating essentially no osteointegration. Our silicon nitride required over five times the force to separate it from its surrounding bone in the presence of bacteria in comparison to titanium.
In 2008, we conducted an animal study in which we evaluated the level of osteointegration of our porous CSC silicon nitride with a knee-defect model in adult sheep. At three months after implantation, three out of five of the silicon nitride implants had extensive new bone formation at and into the implant surface, showing that the bone had grown into our CSC silicon nitride to a depth of 3 millimeters, or mm. This animal study demonstrated the rapid osteointegration potential of our CSC silicon nitride.
Hardness, Strength and Resistance to Fracture
Comparative Information
As shown in the table of comparative information publicly available about various biomaterials below:
| • | the hardness, or a material’s resistance to deformity, of silicon nitride is comparable to traditional ceramics, but is substantially higher than either polymers or metals; |
81
| • | the strength of silicon nitride is comparable or higher than metals and traditional ceramics, and is about sixteen to fifty-five times stronger than highly-cross-linked polyethylene, and four to eight times stronger than PEEK; and |
| • | silicon nitride has the highest fracture resistance of any medical ceramic material and is three to eleven times more resistant to fracture than PEEK or highly-cross-linked polyethylene. This is due to the interwoven microstructure of silicon nitride. Metals have the highest fracture resistance. |
| Comparison of Mechanical Properties Among Orthopedic Biomaterials | ||||||
| Material | Hardness (GPa)(1) |
Strength (MPa)(1) |
Fracture Resistance (MPa.m1/2)(1) | |||
| Silicon Nitride | 13 – 16 | 800 – 1200 | 8 – 11 | |||
| Aluminum Oxide Ceramic | 14 – 19 | 300 – 500 | 3 – 5 | |||
| Zirconia-Toughened Alumina Ceramic | 12 – 19 | 700 – 1150 | 5 – 10 | |||
| PEEK | 0.09 – 0.28 | 160 – 180 | 2 – 3 | |||
| Highly-Cross-Linked Polyethylene Polymer | 0.03 – 0.07 | 22 – 48 | 1 – 2 | |||
| Cobalt-Chromium Metal | 3 – 4 | 700 – 1000 | 50 – 100 | |||
| Titanium Alloy Metal | 3 – 4 | 920 – 980 | 75 | |||
| (1) | GPa is a giga-pascal. MPa is a mega-pascal. Pascals are a measure of pressure. MPa.m1/2 is mega-pascal times a square root meter and is a measure related to the energy required to initiate fracture of a material. |
We believe that the combination of high hardness, strength and fracture resistance positions our silicon nitride as an ideal biomaterial for many medical applications.
Burst Strength
In 2006, we conducted in-house comparative “burst strength” tests on femoral heads made from our silicon nitride produced by a contract manufacturer to our specifications and femoral heads made from one of the strongest commercially available ceramics, BIOLOX® delta (zirconia-toughened alumina). These tests were performed on three designs of 28 mm femoral heads using accepted testing protocols. The tests involved applying a load to each femoral head while mounted on a cobalt-chromium simulated hip implant stem, until the head burst. This enabled us to directly compare the strength of the femoral heads made of the two biomaterials. The results also provided an indication of each biomaterial’s resistance to fracture. The results of these tests are shown in the chart below.
The average burst test strength for the silicon nitride femoral heads in these tests was 75 kilonewtons, or kNs, compared with 65 kN for BIOLOX® delta, or about a 15% improvement. The burst strengths observed in our tests for BIOLOX® delta femoral heads are comparable to those observed by an independent party testing the same design BIOLOX® delta femoral heads as we did. We also conducted burst strength tests of 36 mm femoral heads made from our silicon nitride which showed those femoral heads had burst strengths that averaged 164 kN.
82
Resistance to Wear
In 2011, we commissioned an independent laboratory to conduct a wear study using our silicon nitride femoral heads. We tested our 28 mm silicon nitride femoral heads articulated against cross-linked polyethylene acetabular liners and our 40 mm silicon nitride femoral heads articulated against cross-linked polyethylene acetabular liners using well-established protocols in a hip simulator for their wear performance over 5 million cycles. We then compared the results for our silicon nitride product candidates to the results for the cobalt chrome femoral head and publicly available data from other commonly paired products. The results and comparison showed that:
| • | our silicon nitride-on-cross-linked polyethylene had approximately half the wear rate of that publicly reported for cobalt chrome-on-cross-linked polyethylene articulating hip components; and |
| • | our silicon nitride-on-cross-linked polyethylene had comparable wear to that publicly reported for traditional ceramic-on-cross-linked polyethylene articulating hip components. |
Anti-Infective Properties
The results of the two studies at Brown University in 2012, demonstrate that our solid MC2 silicon nitride has anti-infective properties. The objective of the in vitro study was to determine how our silicon nitride, PEEK and titanium interact with bacteria, protein and bone cells without the use of antibiotics and compared the growth of five different types of bacteria on silicon nitride, PEEK and titanium over time. Live bacteria counts were between 8 to 30 times lower on silicon nitride than PEEK and up to 8 times lower on silicon nitride than titanium.
In the in vivo study, bacteria were applied to the biomaterials before implantation. Three months after implantation, no infection was observed with silicon nitride, whereas both PEEK and titanium showed infection. The data demonstrate that our silicon nitride inhibits biofilm formation and bacterial colonization around the biomaterial.
Imaging Compatibility
In 2007, we conducted a study to compare the imaging characteristics of test blanks made of PEEK, the metals titanium and tantalum, and silicon nitride using a cadaver human vertebral body. Images of the vertebral body and the blanks were obtained using x-ray, CT and MRI under identical conditions. We assessed the radiolucent characteristics of the blanks in x-ray images quantitatively, assessed the presence of scatter in CT qualitatively and assessed distortion in MRI quantitatively. In x-ray, the metal blanks did not permit visualization of the underlying bone of the vertebral body, while PEEK was transparent, rendering its location difficult to determine. The silicon nitride blank had an intermediate radiolucency that rendered it visible and allowed a visual assessment of the underlying bone of the vertebral body. CT and MRI of the metal blanks indicated the presence of distortion while silicon nitride and PEEK exhibited no scattering.
Sales and Marketing
We market and sell our products to surgeons and hospitals through our established network of more than 50 independent sales distributors who are managed by our experienced 14 person in-house sales and marketing management team. Our sales efforts to date have been in the United States and selected markets in Europe and South America. To supplement our independent sales distributors, in select international markets, such as Europe, Japan, Australia and Canada, we may also seek to establish collaborations with leading orthopedic companies where we believe that a large, well-established partner may provide better access to those markets. For example, in October 2013, we entered into a European sales agent agreement with K2M, Inc., one of the largest privately held spinal device companies in the world. In addition, we may establish collaborations in the United States under circumstances where access to a larger sales and marketing organization may help to expand the market or accelerate penetration for selected products.
In the first quarter of 2013, we restructured the leadership of our sales and marketing team and hired a Senior Vice President of Global Sales, a Vice President of Marketing and a Senior Vice President, Strategic Marketing. This new leadership team has reviewed our entire sales and marketing practices and are implementing steps to improve the performance of these departments.
In addition to leveraging the strong existing surgeon relationships of our distribution network, we market our products through a combination of initiatives that are designed to establish and increase awareness of our silicon
83
nitride products and their benefits over alternative products. We attend and make presentations at major industry events, including society meetings sponsored by the North American Spine Society, the America Academy of Orthopaedic Surgeons and the Congress of Neurological Surgeons, to educate surgeons and distributors about our products and product candidates. We advertise in trade journals and publications, and offer unique pricing strategies, including product bundling and incentivizing our distribution network to create and maintain long-term relationships with surgeons and hospitals. We also use surgeon advisors to assist in product development and to help implement awareness campaigns aimed at educating surgeons about our products. As part of these campaigns, we provide educational materials for hospitals and surgeons. We also conduct regional training seminars where our product managers, trainers, engineers, sales and marketing staff members work together with our surgeon advisors to educate surgeons and our distribution network in the use of our products.
Manufacturing
Silicon Nitride Manufacturing
To control the quality, cost and availability of our silicon nitride products and product candidates, we operate our own manufacturing facility. Our 54,000 square foot corporate building includes a 30,000 square foot ISO 13485 certified medical device manufacturing space. It is equipped with state-of-the-art, powder processing, spray drying, pressing and computerized machining equipment, sintering furnaces, and other testing equipment that enables us to control the entire manufacturing process for our silicon nitride products and product candidates. To our knowledge, we are the only vertically integrated silicon nitride orthopedic medical device manufacturer in the world. All operations with the exceptions of raw material production, cleaning, packaging and sterilization are performed in-house. We purchase raw materials, consisting of silicon nitride ceramic powder and dopant chemical compounds, from several vendors which are ISO registered and approved by us. These raw materials are characterized and tested in our facility in accordance with our specifications and then blended to formulate our silicon nitride. We believe that there are multiple vendors that can supply us these raw materials and we continually monitor the quality and pricing offered by our vendors to ensure high quality and cost-effective supply of these materials. A flowchart of the silicon nitride manufacturing process is shown below.
In November 2013, we entered into a cooperative research and development agreement with Kyocera under which we will work with Kyocera to determine its ability to become a second qualified manufacturer of our silicon nitride-based spinal fusion products and product candidates.
Non-Silicon Nitride and Instruments Manufacturing
We obtain our non-silicon nitride spinal fusion products and instruments from third-party manufacturers. We also plan to rely on third-party manufacturers for the supply of the metal components of our silicon nitride hip and knee joint replacement product candidates. We only use manufacturers that operate under QSR and are ISO 13485 certified. Our in-house quality control group examines subcontracted components to ensure that they meet our required specifications. We believe that the use of third-party sources for non-silicon nitride spinal fusion products and instruments will reduce our capital investment requirements and allow us to strategically focus our resources on the manufacture of our silicon nitride products and product candidates.
Intellectual Property
We rely on a combination of patents, trademarks, trade secrets and other forms of intellectual property, nondisclosure agreements, proprietary information ownership agreements and other measures to protect our intellectual property rights. We believe that in order to have a competitive advantage, we must continue to develop and maintain the proprietary aspects of our technologies.
84
We currently have 34 issued U.S. patents, 38 pending U.S. patent applications, 11 granted foreign patents and 18 pending foreign patent applications. Our issued patents begin to expire in 2014, with the last of these patents expiring in 2031. The first core patents do not expire until 2022; these include US 6,881,229 and US 6,790,233.
We have seven U.S patents, one European patent, and related pending applications, directed to articulating implants using our high-strength, high toughness doped silicon nitride MC2 ceramic. The issued patents, which include US 6,881,229; US 7,666,229; US 8,123,812; US 7,780,738; US 7,695,521; US 7,776,085; US 8,133,284; and EP 1408874, begin to expire in 2022. We also have two U.S. patents, two European patents, and related pending applications, related to our CSC technology that are directed to implants that have both a dense load-bearing, or cortical, component and a porous, or cancellous, component, together with a surface coating. The issued patents, which include US 6,790,233; US 6,846,327; EP 1389978; and EP 2055267, begin to expire in 2022.
We also have three U.S. patents and related foreign counterparts that we acquired in July 2012 from Dytech Corporation Ltd., or Dytech, directed to manufacturing processes for the production of porous ceramics for use in our orthopedic implants. These patents, which include US 5,563,106; US 5,705,448; and US 6,617,270, expire between 2014 and 2019. Under our acquisition agreement with Dytech, Dytech granted to us a perpetual, irrevocable and exclusive license, including the right to grant sublicenses, to certain improvements and know-how related to the acquired patents. In return, we are required to pay Dytech a low single-digit royalty on net sales of products sold by us, our affiliates, or our licensees that are covered by one or more valid claims of these patents, and a percentage of any non-royalty licensing income we may receive in the event we grant a license to others.
Our remaining issued patents and pending applications are directed to additional aspects of our products and technologies including, among other things:
| • | designs for cervical plates; |
| • | designs for pedicle screws; |
| • | designs for cervical disc implants; |
| • | designs for intervertebral fusion devices; |
| • | designs for facet fixation devices; |
| • | designs for hip implants; and |
| • | designs for knee implants. |
We also expect to rely on trade secrets, know-how, continuing technological innovation and in-licensing opportunities to develop and maintain our intellectual property position. However, trade secrets are difficult to protect. We seek to protect the trade secrets in our proprietary technology and processes, in part, by entering into confidentiality agreements with commercial partners, collaborators, employees, consultants, scientific advisors and other contractors and into invention assignment agreements with our employees and some of our commercial partners and consultants. These agreements are designed to protect our proprietary information and, in the case of the invention assignment agreements, to grant us ownership of the technologies that are developed.
Competition
The main alternatives to our silicon nitride biomaterial include: PEEK, which is predominantly manufactured by Invibio, BIOLOX® delta, which is a traditional ceramic manufactured by CeramTec, allograft bone, metals and coated metals.
We believe our main competitors in the orthopedic implant market, which utilize a variety of competitive biomaterials, include: Medtronic, Inc.; DePuy Synthes Companies, a group of Johnson & Johnson companies; Stryker Corporation; Biomet, Inc.; Zimmer Holdings, Inc.; Smith & Nephew plc; and Aesculap Inc. Presently, these companies buy ceramic components on an OEM basis from manufacturers such as CeramTec, Kyocera and CoorTek, Inc., among others. We anticipate that these and other orthopedic companies and OEMs will seek to introduce new biomaterials and products that compete with ours.
Competition within the industry is primarily based on technology, innovation, product quality, and product awareness and acceptance by surgeons. Our principal competitors have substantially greater financial, technical and marketing resources, as well as significantly greater manufacturing capabilities than we do, and they may
85
succeed in developing products that render our implants and product candidates non-competitive. Our ability to compete successfully will depend upon our ability to develop innovative products with advanced performance features based on our silicon nitride technologies.
Government Regulation of Medical Devices
Governmental authorities in the United States, at the federal, state and local levels, and other countries extensively regulate, among other things, the research, development, testing, manufacture, labeling, promotion, advertising, distribution, marketing and export and import of products such as those we are commercializing and developing. Failure to obtain approval or clearance to market our products and products under development and to meet the ongoing requirements of these regulatory authorities could prevent us from continuing to market or develop our products and product candidates.
United States
Pre-Marketing Regulation
In the United States, medical devices are regulated by the FDA. Unless an exemption applies, a new medical device will require either prior 510(k) clearance or approval of a premarket approval application, or PMA, before it can be marketed in the United States. The information that must be submitted to the FDA in order to obtain clearance or approval to market a new medical device varies depending on how the medical device is classified by the FDA. Medical devices are classified into one of three classes on the basis of the controls deemed by the FDA to be necessary to reasonably ensure their safety and effectiveness. Class I devices, which are those that have the lowest level or risk associated with them, are subject to general controls, including labeling, premarket notification and adherence to the QSR. Class II devices are subject to general controls and special controls, including performance standards. Class III devices, which have the highest level of risk associated with them, are subject to most of the previously identified requirements as well as to premarket approval. Most Class I devices and some Class II devices are exempt from the 510(k) requirement, although manufacturers of these devices are still subject to registration, listing, labeling and QSR requirements.
A 510(k) premarket notification must demonstrate that the device in question is substantially equivalent to another legally marketed device, or predicate device, that did not require premarket approval. In evaluating the 510(k), the FDA will determine whether the device has the same intended use as the predicate device, and (a) has the same technological characteristics as the predicate device, or (b) has different technological characteristics, and (i) the data supporting the substantial equivalence contains information, including appropriate clinical or scientific data, if deemed necessary by the FDA, that demonstrates that the device is as safe and as effective as a legally marketed device, and (ii) does not raise different questions of safety and effectiveness than the predicate device. Most 510(k)s do not require clinical data for clearance, but the FDA may request such data. The FDA’s goal is to review and act on each 510(k) within 90 days of submission, but it may take longer based on requests for additional information. In addition, requests for additional data, including clinical data, will increase the time necessary to review the notice. If the FDA does not agree that the new device is substantially equivalent to the predicate device, the new device will be classified in Class III, and the manufacturer must submit a PMA. Since July 2012, however, with the enactment of the Food and Drug Administration Safety and Innovation Act, or FDASIA, a de novo pathway is directly available for certain low to moderate risk devices that do not qualify for the 510(k) pathway due to lack of a predicate device. Modifications to a 510(k)-cleared medical device may require the submission of another 510(k) or a PMA if the changes could significantly affect the safety or effectiveness or constitute a major change in the intended use of the device.
Modifications to a 510(k)-cleared device frequently require the submission of a traditional 510(k), but modifications meeting certain conditions may be candidates for FDA review under a Special 510(k). If a device modification requires the submission of a 510(k), but the modification does not affect the intended use of the device or alter the fundamental scientific technology of the device, then summary information that results from the design control process associated with the cleared device can serve as the basis for clearing the application. A Special 510(k) allows a manufacturer to declare conformance to design controls without providing new data. When the modification involves a change in material, the nature of the “new” material will determine whether a traditional or Special 510(k) is necessary. For example, in its Device Advice on How to Prepare a Special 510(k),
86
the FDA uses the example of a change in a material in a finger joint prosthesis from a known metal alloy to a ceramic that has not been used in a legally marketed predicate device as a type of change that should not be submitted as a Special 510(k). However, if the “new” material is a type that has been used in other legally marketed devices within the same classification for the same intended use, a Special 510(k) is appropriate. The FDA gives as an example a manufacturer of a hip implant who changes from one alloy to another that has been used in another legally marketed predicate. Special 510(k)s are typically processed within 30 days of receipt.
The PMA process is more complex, costly and time consuming than the 510(k) clearance procedure. A PMA must be supported by extensive data including, but not limited to, technical, preclinical, clinical, manufacturing, control and labeling information to demonstrate to the FDA’s satisfaction the safety and effectiveness of the device for its intended use. After a PMA is submitted, the FDA has 45 days to determine whether it is sufficiently complete to permit a substantive review. If the PMA is complete, the FDA will file the PMA. The FDA is subject to performance goal review times for PMAs and may issue a decision letter as a first action on a PMA within 180 days of filing, but if it has questions, it will likely issue a first major deficiency letter within 150 days of filing. It may also refer the PMA to an FDA advisory panel for additional review, and will conduct a preapproval inspection of the manufacturing facility to ensure compliance with the QSR, either of which could extend the 180-day response target. While the FDA’s ability to meet its performance goals has generally improved during the past few years, it may not meet these goals in the future. A PMA can take several years to complete and there is no assurance that any submitted PMA will ever be approved. Even when approved, the FDA may limit the indication for which the medical device may be marketed or to whom it may be sold. In addition, the FDA may request additional information or request the performance of additional clinical trials before it will reconsider the approval of the PMA or as a condition of approval, in which case the trials must be completed after the PMA is approved. Changes to the device, including changes to its manufacturing process, may require the approval of a supplemental PMA.
If a medical device is determined to present a “significant risk,” the manufacturer may not begin a clinical trial until it submits an investigational device exemption, or IDE, to the FDA and obtains approval of the IDE from the FDA. The IDE must be supported by appropriate data, such as animal and laboratory testing results and include a proposed clinical protocol. These clinical trials are also subject to the review, approval and oversight of an institutional review board, or IRB, which is an independent and multi-disciplinary committee of volunteers who review and approve research proposals, and the reporting of adverse events and experiences, at each institution at which the clinical trial will be performed. The clinical trials must be conducted in accordance with applicable regulations, including but not limited to the FDA’s IDE regulations and current good clinical practices. A clinical trial may be suspended by the FDA, the IRB or the sponsor at any time for various reasons, including a belief that the risks to the study participants outweigh the benefits of participation in the trial. Even if a clinical trial is completed, the results may not demonstrate the safety and efficacy of a device, or may be equivocal or otherwise not be sufficient to obtain approval.
Post-Marketing Regulation
After a device is placed on the market, numerous regulatory requirements apply. These include:
| • | compliance with the QSR, which require manufacturers to follow stringent design, testing, control, documentation, record maintenance, including maintenance of complaint and related investigation files, and other quality assurance controls during the manufacturing process; |
| • | labeling regulations, which prohibit the promotion of products for uncleared or unapproved or “off-label” uses and impose other restrictions on labeling; and |
| • | medical device reporting obligations, which require that manufacturers investigate and report to the FDA adverse events, including deaths, or serious injuries that may have been or were caused by a medical device and malfunctions in the device that would likely cause or contribute to a death or serious injury if it were to recur. |
Failure to comply with applicable regulatory requirements can result in enforcement action by the FDA, which may include any of the following sanctions:
| • | warning letters; |
| • | fines, injunctions, and civil penalties; |
87
| • | recall or seizure of our products; |
| • | operating restrictions, partial suspension or total shutdown of production; |
| • | refusal to grant 510(k) clearance or PMA approvals of new products; |
| • | withdrawal of 510(k) clearance or PMA approvals; and |
| • | criminal prosecution. |
To ensure compliance with regulatory requirements, medical device manufacturers are subject to market surveillance and periodic, pre-scheduled and unannounced inspections by the FDA, and these inspections may include the manufacturing facilities of our subcontractors.
International Regulation
International sales of medical devices are subject to foreign government regulations, which vary substantially from country to country. The time required to obtain approval by a foreign country may be longer or shorter than that required for FDA approval, and the requirements may differ. For example, the primary regulatory authority with respect to medical devices in Europe is that of the European Union. The European Union consists of 28 countries and has a total population of over 500 million people. The unification of these countries into a common market has resulted in the unification of laws, standards and procedures across these countries, which may expedite the introduction of medical devices like those we are offering and developing. Norway, Iceland, Lichtenstein and Switzerland are not members of the European Union, but have transposed applicable European medical device laws into their national legislation. Thus, a device that is marketed in the European Union may also be recognized and accepted in those four non-member European countries as well.
The European Union has adopted numerous directives and standards regulating the design, manufacture, clinical trials, labeling and adverse event reporting for medical devices. Devices that comply with the requirements of relevant directives will be entitled to bear CE Conformity Marking, indicating that the device conforms to the essential requirements of the applicable directives and, accordingly, can be commercially distributed throughout the European Union. Actual implementation of these directives, however, may vary on a country-by-country basis. The CE Mark is a mandatory conformity mark on medical devices distributed and sold in the European Union and certifies that a medical device has met applicable requirements.
The method of assessing conformity varies, but normally involves a combination of self-assessment by the manufacturer and a third-party assessment by a “Notified Body.” Notified Bodies are independent testing houses, laboratories, or product certifiers authorized by the E.U. member states to perform the required conformity assessment tasks, such as quality system audits and device compliance testing. An assessment by a Notified Body based within the European Union is required in order for a manufacturer to distribute the product commercially throughout the European Union. Medium and higher risk devices require the intervention of a Notified Body which will be responsible for auditing the manufacturer’s quality system. The Notified Body will also determine whether or not the product conforms to the requirements of the applicable directives. Devices that meet the applicable requirements of E.U. law and have undergone the appropriate conformity assessment routes will be granted CE “certification.”
The CE Mark is mandatory for medical devices sold not only within the countries of the European Union but more generally within all countries in western Europe. As many of the European standards are converging with international standards, the CE Mark is often used on medical devices manufactured and sold outside of Europe (notably in Asia that exports many manufactured products to Europe). CE Marking gives companies easier access into not only the European market but also to Asian and Latin American markets, most of whom recognize the CE Mark on medical device as a mark of quality and adhering to international standards of consumer safety, health or environmental requirements.
In September 2012, the European Commission adopted a proposal for a regulation which, if adopted, will change the way that most medical devices are regulated in the European Union, and may subject our products to additional requirements.
88
Compliance with Healthcare Laws
We must comply with various U.S. federal and state laws, rules and regulations pertaining to healthcare fraud and abuse, including anti-kickback and false claims laws, rules, and regulations, as well as other healthcare laws in connection with the commercialization of our products. Fraud and abuse laws are interpreted broadly and enforced aggressively by various state and federal agencies, including the U.S. Department of Justice, the U.S. Office of Inspector General for the Department of Health and Human Services and various state agencies.
We have entered into agreements with certain surgeons for assistance with the design of our products, some of whom we anticipate may make referrals to us or order our products. A majority of these agreements contain provisions for the payments of royalties and/or stock options. In addition, some surgeons currently own shares of our stock. We have structured these transactions with the intention of complying with all applicable laws, including fraud and abuse, data privacy and security, and transparency laws. Despite this intention, there can be no assurance that a particular government agency or court would determine our practices to be in full compliance with such laws. We could be materially impacted if regulatory or enforcement agencies or courts interpret our financial arrangements with surgeons to be in violation of healthcare laws, including, without limitation, fraud and abuse, data privacy and security, or transparency laws.
The U.S. federal Anti-Kickback Statute prohibits persons, including a medical device manufacturer (or a party acting on its behalf), from knowingly or willfully soliciting, receiving, offering or paying remuneration, directly or indirectly, in exchange for or to induce either the referral of an individual for a service or product or the purchasing, ordering, arranging for, or recommending the ordering of, any service or product for which payment may be made by Medicare, Medicaid or any other federal healthcare program. This statute has been interpreted to apply to arrangements between medical device manufacturers on one hand and healthcare providers on the other. The term “remuneration” is not defined in the federal Anti-Kickback Statute and has been broadly interpreted to include anything of value, such as cash payments, gifts or gift certificates, discounts, waiver of payments, credit arrangements, ownership interests, the furnishing of services, supplies or equipment, and the provision of anything at less than its fair market value. Courts have broadly interpreted the scope of the law, holding that it may be violated if merely “one purpose” of an arrangement is to induce referrals, irrespective of the existence of other legitimate purposes. The Anti-Kickback Statute prohibits many arrangements and practices that are lawful in businesses outside of the healthcare industry. Although there are a number of statutory exemptions and regulatory safe harbors protecting certain business arrangements from prosecution, the exemptions and safe harbors are drawn narrowly, and practices that involve remuneration intended to induce prescribing, purchasing or recommending may be subject to scrutiny if they do not qualify for an exemption or safe harbor. Our practices may not in all cases meet all of the criteria for safe harbor protection from federal Anti-Kickback Statute liability. The reach of the Anti-Kickback Statute was broadened by the recently enacted Patient Protection and Affordable Care Act of 2010 and the Health Care and Education Affordability Reconciliation Act of 2010, collectively, the Affordable Care Act or ACA, which, among other things, amends the intent requirement of the federal Anti-Kickback Statute such that a person or entity no longer needs to have actual knowledge of the statute or specific intent to violate it in order to have committed a violation. In addition, the ACA provides that the government may assert that a claim including items or services resulting from a violation of the federal Anti-Kickback Statute constitutes a false or fraudulent claim for purposes of the federal False Claims Act (discussed below) or the civil monetary penalties statute, which imposes fines against any person who is determined to have presented or caused to be presented claims to a federal healthcare program that the person knows or should know is for an item or service that was not provided as claimed or is false or fraudulent. In addition to the federal Anti-Kickback Statute, many states have their own anti-kickback laws. Often, these laws closely follow the language of the federal law, although they do not always have the same scope, exceptions, safe harbors or sanctions. In some states, these anti-kickback laws apply not only to payments made by government healthcare programs but also to payments made by other third-party payors, including commercial insurance companies.
Sales, marketing, consulting, and advisory arrangements between medical device manufacturers and sales agents and physicians are subject to the Anti-Kickback Statute and other fraud and abuse laws. Government officials have focused recent enforcement efforts on, among other things, the sales and marketing activities of healthcare companies, including medical device manufacturers, and have brought cases against individuals or entities whose
89
personnel allegedly offered unlawful inducements to potential or existing customers in an attempt to procure their business. We expect these activities to continue to be a focus of government enforcement efforts. Settlements of these cases by healthcare companies have involved significant fines and penalties and in some instances criminal plea agreements. We are also aware of governmental investigations of some of the largest orthopedic device companies reportedly focusing on consulting and service agreements between these companies and orthopedic surgeons. These developments are ongoing and we cannot predict the effects they will have on our business.
The federal False Claims Act imposes liability on any person that, among other things, knowingly presents, or causes to be presented, a false or fraudulent claim for payment by a federal healthcare program. The qui tam provisions of the False Claims Act allow a private individual to bring civil actions on behalf of the federal government alleging that the defendant has submitted a false claim, or has caused such a claim to be submitted, to the federal government, and to share in any monetary recovery. There are many potential bases for liability under the False Claims Act. Liability arises, primarily, when a person knowingly submits, or causes another to submit, a false claim for reimbursement to the federal government. The False Claims Act has been used to assert liability on the basis of inadequate care, kickbacks, and other improper referrals, and allegations as to misrepresentations with respect to the services rendered. Qui tam actions have increased significantly in recent years, causing greater numbers of healthcare companies, including medical device manufacturers, to defend false claim actions, pay damages and penalties, or be excluded from participation in Medicare, Medicaid or other federal or state healthcare programs as a result of investigations arising out of such actions. In addition, various states have enacted similar laws analogous to the False Claims Act. Many of these state laws apply where a claim is submitted to any third-party payor and not merely a federal healthcare program. We are unable to predict whether we would be subject to actions under the False Claims Act or a similar state law, or the impact of such actions. However, the cost of defending such claims, as well as any sanctions imposed, could adversely affect our financial performance. The Health Insurance Portability and Accountability Act of 1996, or HIPAA, also created several new federal crimes, including healthcare fraud and false statements relating to healthcare matters. The healthcare fraud statute prohibits knowingly and willfully executing a scheme to defraud any healthcare benefit program, including private third party payors. The false statements statute prohibits knowingly and willfully falsifying, concealing, or covering up a material fact or making any materially false, fictitious, or fraudulent statement in connection with the delivery of or payment for healthcare benefits, items, or services.
In addition, we may be subject to, or our marketing or research activities may be limited by, data privacy and security regulation by both the federal government and the states in which we conduct our business. For example, HIPAA and its implementing regulations established uniform federal standards for certain “covered entities” (healthcare providers, health plans and healthcare clearinghouses) governing the conduct of certain electronic healthcare transactions and protecting the security and privacy of protected health information. The American Recovery and Reinvestment Act of 2009, commonly referred to as the economic stimulus package, included expansion of HIPAA’s privacy and security standards called the Health Information Technology for Economic and Clinical Health Act, or HITECH, which became effective on February 17, 2010. Among other things, HITECH makes HIPAA’s privacy and security standards directly applicable to “business associates”—independent contractors or agents of covered entities that create, receive, maintain, or transmit protected health information in connection with providing a service for or on behalf of a covered entity. HITECH also increased the civil and criminal penalties that may be imposed against covered entities, business associates and possibly other persons, and gave state attorneys general new authority to file civil actions for damages or injunctions in federal courts to enforce the federal HIPAA laws and seek attorney’s fees and costs associated with pursuing federal civil actions. These laws also require the reporting of breaches of protected health information to affected individuals, regulators and in some cases, local or national media. HIPAA and HITECH impose strict limits on our physician collaborators’ ability to use and disclose patient information on our behalf.
There are also an increasing number of state “sunshine” laws that require manufacturers to provide reports to state governments on pricing and marketing information. Several states have enacted legislation requiring medical device companies to, among other things, establish marketing compliance programs, file periodic reports with the state, make periodic public disclosures on sales and marketing activities, and to prohibit or limit certain other sales and marketing practices. In addition, a federal law known as the Physician Payments Sunshine Act,
90
now requires medical device manufacturers to track and report to the federal government certain payments and other transfers of value made to physicians and teaching hospitals and ownership or investment interests held by physicians and their immediate family members. The federal government will disclose the reported information on a publicly available website beginning in 2014. These laws may adversely affect our sales, marketing, and other activities by imposing administrative and compliance burdens on us. If we fail to track and report as required by these laws or to otherwise comply with these laws, we could be subject to the penalty provisions of the pertinent state and federal authorities.
Clinical research is heavily regulated by FDA regulations for the protection of human subjects (21 C.F.R. 50 and 56) and also the regulations of the U.S Department of Health and Human Services, or the Common Rule (45 C.F.R 46). Both FDA human subject regulations and the Common Rule impose restrictions on the involvement of human subjects in clinical research and require, among other things, the balancing of the risks and benefits of research, the documented informed consent of research participants, initial and ongoing review of research by an IRB. Similar regulations govern research conducted in foreign countries. Compliance with human subject protection regulations is costly and time consuming. Failure to comply could substantially and adversely impact our research program and the development of our products.
Because of the breadth of these laws and the narrowness of available statutory and regulatory exemptions, it is possible that some of our business activities could be subject to challenge under one or more of such laws. If our operations are found to be in violation of any of the federal and state laws described above or any other governmental regulations that apply to us, we may be subject to penalties, including criminal and significant civil monetary penalties, damages, fines, imprisonment, exclusion from participation in government healthcare programs, injunctions, recall or seizure of products, total or partial suspension of production, denial or withdrawal of pre-marketing product clearances and approvals, private “qui tam” actions brought by individual whistleblowers in the name of the government or refusal to allow us to enter into supply contracts, including government contracts, and the curtailment or restructuring of our operations. Public disclosure of privacy and data security violations could cause significant reputational harm. Any of these events could adversely affect our ability to operate our business and our results of operations. To the extent that any of our products are sold in a foreign country, we may be subject to similar foreign laws and regulations, which may include, for instance, applicable post-marketing requirements, including safety surveillance, anti-fraud and abuse laws, implementation of corporate compliance programs, as well as laws and regulations requiring transparency of pricing and marketing information and governing the privacy and security of health information, such as the E.U.’s Directive 95/46 on the Protection of Individuals with regard to the Processing of Personal Data, or the Data Directive, and the wide variety of national laws implementing the Data Directive.
Healthcare Reform
In the United States and foreign jurisdictions, there have been a number of legislative and regulatory changes to the healthcare system that could affect our future results of operations. In particular, there have been and continue to be a number of initiatives at the U.S. federal and state levels that seek to reduce healthcare costs.
In March 2010, President Obama signed into law the ACA, a sweeping law intended to broaden access to health insurance, reduce or constrain the growth of healthcare spending, enhance remedies against healthcare fraud and abuse, add new transparency requirements for healthcare and health insurance industries, impose new taxes and fees on pharmaceutical and medical device manufacturers and impose additional health policy reforms. Among other things, the ACA imposes a 2.3% medical device excise tax on sales of many medical devices in the United States which became effective on January 1, 2013. Substantial new provisions affecting compliance have also been enacted, which may affect our business practices with healthcare practitioners and a significant number of provisions are not yet, or have only recently become, effective. Although it is too early to determine the full effect of the ACA, the new law appears likely to place downward pressure on pricing of medical devices, especially under the Medicare program, and may also increase our regulatory burdens and operating costs.
In addition, other legislative changes have been proposed and adopted since the ACA was enacted. For example, on August 2, 2011, the President signed into law the Budget Control Act of 2011, which, among other things, created the Joint Select Committee on Deficit Reduction to recommend to Congress proposals in spending
91
reductions. The Joint Select Committee on Deficit Reduction did not achieve a targeted deficit reduction of at least $1.2 trillion for the years 2013 through 2021, triggering the legislation’s automatic reduction to several government programs. This includes aggregate reductions to Medicare payments to providers of up to 2% per fiscal year, starting in 2013. On January 2, 2013, President Obama signed into law the American Taxpayer Relief Act of 2012, or ATRA, which, among other things, reduced Medicare payments to several types of providers and increased the statute of limitations period for the government to recover overpayments to providers from three to five years. On March 1, 2013, the President signed an executive order implementing the Budget Control Act’s 2% Medicare payment reductions, and on April 1, 2013, these reductions went into effect. These new laws may result in additional reductions in Medicare and other healthcare funding, which could have a material adverse effect on our financial operations.
We expect that the ACA, as well as other healthcare reform measures that have been and may be adopted in the future, may result in more rigorous coverage criteria and in additional downward pressure on the price that we receive for our products. Any reduction in reimbursement from Medicare or other government programs may result in a similar reduction in payments from private payors. The implementation of cost containment measures or other healthcare reforms may affect our ability to generate revenue and profits or commercialize our product candidates.
Third-Party Reimbursement
Because we typically receive payment directly from hospitals and surgical centers, we do not anticipate relying directly on payment for any of our products from third-party payors, such as Medicare, Medicaid, private insurers, and managed care companies. However, our business will be affected by policies administered by federal and state healthcare programs, such as Medicare and Medicaid, as well as private third-party payors, which often follow the policies of the state and federal healthcare programs. For example, our business will be indirectly impacted by the ability of a hospital or medical facility to obtain coverage and third-party reimbursement for procedures performed using our products. Many hospitals and clinics in the United States belong to group purchasing organizations (that typically incentivize their hospital members to make a relatively large proportion of purchases from a limited number of vendors of similar products that have contracted to offer discounted prices). Such contracts often include exceptions for purchasing certain innovative new technologies, however. Accordingly, the commercial success of our products may also depend to some extent on our ability to either negotiate favorable purchase contracts with key group purchasing organizations or persuade hospitals and clinics to purchase our product “off contract.” These third-party payors may deny reimbursement if they determine that a device used in a procedure was not medically necessary; was not used in accordance with cost-effective treatment methods, as determined by the third-party payor; or was used for an unapproved use. A national or local coverage decision denying Medicare coverage for one or more of our products could result in private insurers and other third party payors also denying coverage. Even if favorable coverage and reimbursement status is attained for our products, less favorable coverage policies and reimbursement rates may be implemented in the future. The cost containment measures that third-party payors and providers are instituting, both within the United States and abroad, could significantly reduce our potential revenues from the sale of our products and any product candidates. We cannot provide any assurances that we will be able to obtain and maintain third party coverage or adequate reimbursement for our products and product candidates in whole or in part.
For inpatient and outpatient procedures, including those that will involve use of our products, Medicare and many other third-party payors in the United States reimburse hospitals at a prospectively determined amount. This amount is generally based on one or more diagnosis related groups, or DRGs, associated with the patient’s condition for inpatient treatment and generally based on ambulatory payment classifications, or APCs, associated with the procedures performed as an outpatient at an ambulation surgicenter. Each DRG or APC is associated with a level of payment and may be adjusted from time to time, usually annually. Prospective payments are intended to cover most of the non-physician hospital costs incurred in connection with the applicable diagnosis and related procedures. Implant products, such as those we plan to sell, represent part of the total procedure costs while labor, hospital room and board, and other supplies and services represent the balance of those costs. However, the prospective payment amounts are typically set independently of a particular hospital’s actual costs associated with treating a particular patient and implanting a device. Therefore, the payment that a hospital would receive for a particular hospital visit would not typically take into account the cost of our products.
92
Medicare has established a number of DRGs for inpatient procedures that involve the use of products similar to ours. Although Medicare has authority to create special DRGs for hospital services that more properly reflect the actual costs of expensive or new-technology devices implanted as part of a procedure, it has declined to do so in the past, and we do not expect that it will do so with respect to our current products and product candidates. Medicare’s DRG and APC classifications may have implications outside of Medicare, as many other U.S. third-party payors often use Medicare DRGs and APCs for purposes of determining reimbursement.
We believe that orthopedic implants generally have been well received by third-party payors because of the ability of these implants to greatly reduce long-term healthcare costs for patients with degenerative joint disease. However, coverage and reimbursement policies vary from payor to payor and are subject to change. As discussed above, hospitals that purchase medical devices for treatment of their patients generally rely on third-party payors to reimburse all or part of the costs and fees associated with the procedures performed with these devices. Both government and private third-party coverage and reimbursement levels are critical to new product acceptance. Neither hospitals nor surgeons are likely to use our products if they do not receive reimbursement for the procedures adequate to cover the cost of our products.
While it is expected that hospitals will be able to obtain coverage for procedures using our products, the level of payment available to them for such procedures may change over time. State and federal healthcare programs, such as Medicare and Medicaid, closely regulate provider payment levels and have sought to contain, and sometimes reduce, payment levels. Commercial insurers and managed care plans frequently follow government payment policies, and are likewise interested in controlling increases in the cost of medical care. These third-party payors may deny payment if they determine that a procedure was not medically necessary, a device used in a procedure was not used in accordance with cost-effective treatment methods, as determined by the third-party payor, or was used for an unapproved use.
In addition, some payors are adopting pay-for-performance programs that differentiate payments to healthcare providers based on the achievement of documented quality-of-care metrics, cost efficiencies, or patient outcomes. These programs are intended to provide incentives to providers to find ways to deliver the same or better results while consuming fewer resources. As a result of these programs, and related payor efforts to reduce payment levels, hospitals and other providers are seeking ways to reduce their costs, including the amounts they pay to medical device suppliers. Adverse changes in payment rates by payors to hospitals could adversely impact our ability to market and sell our products and negatively affect our financial performance.
In international markets, healthcare payment systems vary significantly by country and many countries have instituted price ceilings on specific product lines. There can be no assurance that our products will be considered cost-effective by third-party payors, that reimbursement will be available or, if available, that the third-party payors’ reimbursement policies will not adversely affect our ability to sell our products profitably.
Member countries of the European Union offer various combinations of centrally financed healthcare systems and private health insurance systems. The relative importance of government and private systems varies from country to country. Governments may influence the price of medical devices through their pricing and reimbursement rules and control of national healthcare systems that fund a large part of the cost of those products to consumers. Some jurisdictions operate positive and negative list systems under which products may be marketed only once a reimbursement price has been agreed upon. Some of these countries may require, as condition of obtaining reimbursement or pricing approval, the completion of clinical trials that compare the cost-effectiveness of a particular product candidate to currently available therapies. Some E.U. member states allow companies to fix their own prices for devices, but monitor and control company profits. The choice of devices is subject to constraints imposed by the availability of funds within the purchasing institution. Medical devices are most commonly sold to hospitals or healthcare facilities at a price set by negotiation between the buyer and the seller. A contract to purchase products may result from an individual initiative or as a result of a competitive bidding process. In either case, the purchaser pays the supplier, and payment terms vary widely throughout the European Union. Failure to obtain favorable negotiated prices with hospitals or healthcare facilities could adversely affect sales of our products.
93
Employees
As of January 15, 2014, we had 79 employees, including 5 part-time temporary employees, of which 15 are employed in administration, 18 in operations, 35 in manufacturing and research and development, and 11 in sales and marketing. We believe that our success will depend, in part, on our ability to attract and retain qualified personnel. We have never experienced a work stoppage due to labor difficulties and believe that our relations with our employees are good. None of our employees are represented by labor unions.
Facilities
Our 54,000 square foot corporate office and manufacturing facilities are located in Salt Lake City, Utah. We occupy these facilities pursuant to a lease that expires in January 2020. We may extend the lease for two additional periods of five years each. We believe that our existing facilities are adequate for our current and projected needs for the foreseeable future.
Legal Matters
We are currently not a party to any material legal proceedings. However, our industry is characterized by frequent claims and litigation, including claims regarding intellectual property and product liability. As a result, we may be subject to various legal proceedings in the future.
94
Directors and Executive Officers
Our current directors and executive officers and their respective ages and positions are as follows:
| Name |
Age | Position | ||||
| Max E. Link, Ph.D. |
73 | Chairman of the Board of Directors | ||||
| Eric K. Olson |
50 | Director, President and Chief Executive Officer | ||||
| Jay M. Moyes |
59 | Director and Chief Financial Officer | ||||
| B. Sonny Bal, M.D. |
51 | Director | ||||
| David W. Truetzel |
56 | Director | ||||
| Jeffrey S. White |
60 | Director | ||||
| James P. Abraham |
54 | Senior Vice President, Global Sales | ||||
| Kevin Davis |
48 | Chief Operating Officer | ||||
| Bryan J. McEntire |
62 | Chief Technology Officer | ||||
| Kevin Ontiveros |
53 | Chief Legal Officer, Chief Compliance Officer and Corporate Secretary | ||||
| Vytas Rupinskas |
61 | Vice President, Marketing | ||||
| Christopher R. Whitfield |
46 | Chief Commercial Officer | ||||
The following is a brief summary of the background of each of our current directors and executive officers.
Max E. Link, Ph.D. has served as the chairman of our board of directors since October 2003. Dr. Link was chairman of the board of directors and Chief Executive Officer of Centerpulse AG, a medical implant company from March 2002 to October 2003. Prior to joining Centerpulse, Dr. Link was Chief Executive Officer of Corange (Bermuda), the parent company of Boehringer Mannheim Corporation and chairman of the board of directors and chief executive officer of Sandoz Pharma, Ltd., now part of Novartis Corporation, a manufacturer of pharmaceutical products. Dr. Link is chairman of the boards of directors of three publicly listed biopharmaceutical companies, Alexion Pharmaceuticals, Inc., Celsion Corporation and CytRx Corporation. Dr. Link holds a Ph.D. in Economics from University of St. Gallen (Switzerland).
We believe that Dr. Link is qualified to serve as a member of our board of directors because of his significant experience leading companies in our industry as well as the depth of his institutional knowledge of our company.
Eric K. Olson has served as our Chief Executive Officer and President and as a director since February 2012. Prior to serving us in this capacity, Mr. Olson served as our Senior Vice President of Global Marketing from June 2011 through February 2012. From December 2007 to June 2011, Mr. Olson was the Executive Vice President of Sales & Marketing for Axial Biotech, Inc., a molecular diagnostics company. Mr. Olson has also held senior sales and marketing positions with Medtronic, Inc. and Smith & Nephew. Mr. Olson holds a B.S. in Behavioral Science and Health Administration from the University of Utah, and has also completed a master’s-level internship program at the same institution.
We believe that Mr. Olson’s position as the Chief Executive Officer and President of our Company uniquely qualifies him to serve on our board of directors due to his intimate knowledge of our day-to-day operations. Additionally, Mr. Olson possesses a wealth of industry experience related to our business.
Jay M. Moyes has served on our board of directors since November 2012 and as our Chief Financial Officer since October 2013. Since November 2007 Mr. Moyes has been the managing member of Drayton Investments, LLC, a partnership focused on investing in private healthcare related companies and real estate financing. In April 2012, he joined the board of directors of Puma Biotechnology Inc., a biopharmaceutical company. Since May 2006, he has been a member of the board of directors and chairman of the audit committee of Osiris Therapeutics, Inc., a publicly held stem cell therapeutics company. Mr. Moyes is also a director of BioCardia, Inc., a medical device company, and Integrated Diagnostics Inc., a molecular diagnostics company. From May 2008 through July 2009, Mr. Moyes served as the Chief Financial Officer of XDx, Inc., a privately held molecular diagnostics company. Prior to that, he served as the Chief Financial Officer of Myriad Genetics, Inc., a publicly held healthcare diagnostics company, from June 1996 until his retirement in November 2007, and as its
95
Vice President of Finance from July 1993 until July 2005. From 1991 to 1993, Mr. Moyes served as Vice President of Finance and Chief Financial Officer of Genmark, Inc., a privately held genetics company. He held various positions with the accounting firm of KPMG LLP from 1979 through 1991, most recently as a Senior Manager. He also served as a member of the Board of Trustees of the Utah Life Science Association from 1999 through 2006. He holds an M.B.A from the University of Utah and received his B.A. in Economics from Weber State University.
In addition to serving as our Chief Financial Officer, we believe that Mr. Moyes’ experience working with biotechnology companies through their transformation from emerging growth to established, publicly-traded companies qualify him to serve on our board of directors.
B. Sonny Bal, M.D. has served on our board of directors since February 2012. Dr. Bal is Professor & Chief of Adult Reconstruction at the University of Missouri, Columbia, specializing in hip and knee replacement surgery. He also is an Adjunct Professor of Material Sciences at the University of Missouri at Rolla. Dr. Bal is a member of the American Academy of Orthopaedic Surgeons and the American Association of Hip and Knee Surgeons. Dr. Bal received his M.D. degree from Cornell University and an M.B.A. from Northwestern University, and a J.D. from the University of Missouri. Dr. Bal is a licensed attorney and co-founder of the Bal Brenner law firm in North Carolina.
We believe that Dr. Bal’s expertise in orthopedic surgery and his specialty in hip and knee replacement surgery qualifies him to serve on our board of directors.
David W. Truetzel has served on our board of directors since our acquisition of US Spine, Inc. in September 2010. Mr. Truetzel has been the general partner of Augury Capital Partners a private equity fund that invests in life sciences and information technology companies, which he co-founded in 2006. Mr. Truetzel is a director of Enterprise Bank, Inc., Verifi, Inc., a provider of electronic payment solutions, Clearent, LLC, a credit card processing provider, and Paranet, LLC, an IT services provider. Mr. Truetzel holds a B.S. in Business Administration from Saint Louis University, an M.B.A. from The Wharton School and is a licensed C.P.A.
We believe that Mr. Truetzel’s financial and managerial expertise qualify him to serve on our board of directors.
Jeffrey S. White has served on our board of directors since January 2014. Since January 2013, Mr. White has served as Principal at Medtech Advisory Group LLC, a firm he founded that advises early and mid-stage medical technology firms. Mr. White is currently a director of Residency Select LLC, a company which offers psychometric assessment, training and compliance products to medical and surgical residency programs. From May 2006 to December 2012 he served as Global Director of Business Development for Synthes Inc., a global orthopedic firm that was acquired by Johnson and Johnson in 2012. Mr. White has served as Chief Executive Officer and co-founder of several start-up surgical device firms and has previously held executive level positions at Richard-Allan Medical Industries Inc., a medical device manufacturer, which was acquired by Urohealth Systems Inc. and United States Surgical Corporation, unit of Covidien plc. Mr. White holds a B.S. in Biology from Union College in Schenectady NY.
We believe that Mr. White’s experience as an executive and founder of medical device companies qualifies him to serve on our board of directors.
James P. Abraham joined us as Senior Vice President, Global Sales, in January 2013. From January 2007 to December 2013 Mr. Abraham worked in various capacities at Stryker Corporation, a medical equipment company including as Senior Director of Sales. He also previously served as Senior Vice President of Sales and Marketing for IsoTis Orthobiologics, Inc., a company which specializes in human tissue and synthetic grafting and injectable bone growth stimulation. Mr. Abraham holds a B.S. in Business Administration from Creighton University.
Kevin Davis has served as our Chief Operating Officer since June 2012. From December 2011 to June 2012, he served as our President of Manufacturing. From March 2011 to December 2011, he served as our Vice President of Strategy and Business Development. From March 2009 to March 2011, he served as our Cost Accountant, Financial Systems. Mr. Davis was the Chief Financial Officer, from April 2007 to March 2009, of Nevada Chemicals, Inc., a sodium cyanide chemical company and served as one of its directors. Mr. Davis graduated from the University of Utah with a B.S. in Accounting.
96
Bryan J. McEntire has served as our Chief Technology Officer since May 2012. From June 2004 to May 2012 he served as our Vice President of Manufacturing and as our Vice President of Research from December 2006 to May 2012. Mr. McEntire has worked in various advanced ceramic product development, quality engineering and manufacturing roles at Applied Materials, Inc., Norton Advanced Ceramics, a division of Saint-Gobain Industrial Ceramics Corporation, Norton/TRW Ceramics and Ceramatec, Inc., a small producer of ionic-conducting and structural ceramic components located in Salt Lake City, Utah. Mr. McEntire holds a B.S. degree in Materials Science and Engineering and an M.B.A. from the University of Utah.
Kevin Ontiveros has served as our Chief Legal Officer and Chief Compliance Officer since December 2012. Mr. Ontiveros was previously a practicing attorney at Life Science Law PC from February 2011 to December 2012 and Stoel Rives LLP from January 2009 to January 2011, where he provided legal and business counsel on a wide range of matters, including technology licensing transactions, corporate financing opportunities (including public and private equity and debt offerings), public company SEC reporting compliance, and clinical trial, manufacturing, distribution, and research and development agreements. Mr. Ontiveros served as the Vice President-Legal Affairs, General Counsel and Corporate Secretary for ImaRx Therapeutics, Inc. from March 2007 to December 2008 and as the Vice President-Corporate Law and Assistant Corporate Secretary for NPS Pharmaceuticals, Inc. from April 1996 to March 2007. Mr. Ontiveros earned his B.A. from the University of Arizona, his J.D. from the University of Utah School of Law and his L.L.M. in Taxation from the University of Florida.
Vytas Rupinskas is our Vice President of Marketing, a position he has held since December 2012. From September 2005 to March 2012, Mr. Rupinskas served as the Director of Product Management for Leads & Accessories for the Neuromodulation Division of St. Jude Medical, Inc., and Marketing Manager for St. Jude Medical, a provider of implantable medical devices. Prior to his tenure at St. Jude Medical, Mr. Rupinskas served as Senior Product Manager at Exactech, Inc., a provider of implant devices and surgical instruments and held various senior global marketing and international sales management positions at DePuy Orthopaedics, Inc., a medical device company, and its affiliates DePuy International Ltd. and DePuy Spine, Inc. Mr. Rupinskas is a graduate of the University of Illinois with a B.S. degree in Liberal Arts and Sciences and an M.S. in Mechanical Engineering.
Christopher R. Whitfield has served as our Chief Commercial Officer since November 2013. From March 2012 to September 2012, Mr. Whitfield served as the Executive Vice President, Sales and Marketing of Pioneer Surgical Technologies and from October 2009 to March 2012 as its Vice President, Marketing. From October 2008 to September 2009, he served as the West Area Vice President, Sales for Zimmer Spine, a division of Zimmer, Inc. From September 2007 to October 2008, he served as the Senior Director, Marketing of Abbot Spine, Inc., from January 2007 to September 2007 as its Director, Product Management and from June 2005 to January 2007 he served as its Group Manager, Product Marketing. Mr. Whitfield received a B.S. degree in Business Administration, Marketing and Management from the University of Texas at Austin.
Board Composition
Our restated certificate of incorporation and restated bylaws provide that the authorized number of directors may be changed only by resolution of the board of directors. Seven directors are currently authorized. In accordance with our restated certificate of incorporation, immediately upon the closing of this offering, our board of directors will be divided into three classes with staggered three-year terms. At each annual meeting of stockholders following this offering, the successors to the directors whose terms then expire will be elected to serve until the third annual meeting following the election. At the closing of this offering, our directors will be divided among the three classes as follows:
| • | The Class I directors will be Max E. Link, Ph.D. and Jay M. Moyes and their terms will expire at the first annual meeting of stockholders to be held after the completion of this offering; |
| • | The Class II directors will be Eric K. Olson and David W. Truetzel, and their terms will expire at the second annual meeting of stockholders to be held after the completion of this offering; and |
| • | The Class III directors will be B. Sonny Bal, M.D. and Jeffrey S. White, and their terms will expire at the third annual meeting of stockholders to be held after the completion of this offering. |
97
Any additional directorships resulting from an increase in the number of directors will be distributed among the three classes so that, as nearly as possible, each class will consist of one-third of the directors.
Director Independence
Our board of directors has reviewed the materiality of any relationship between us and each of our directors, either directly or indirectly. Based on this review, the board of directors has determined that Max E. Link, Ph.D., David W. Truetzel, Jeffrey S. White and B. Sonny Bal, M.D. are “independent directors” as defined by the SEC and NASDAQ. The rules of The NASDAQ Capital Market require that a majority of the board of directors of a listed company consist of independent directors, as defined by the rules of The NASDAQ Capital Market. We currently have a board of directors consisting of a majority of independent directors.
Committees of the Board of Directors
Our board of directors has an audit committee, a compensation committee and, immediately upon the closing of this offering, a nominating and corporate governance committee, each of which has the composition and responsibilities described below. The rules of The NASDAQ Capital Market require that the audit committee consist of at least three members of our board of directors, each of whom must be independent, as established under the rules of The NASDAQ Capital Market and the SEC.
Audit Committee
At the closing of this offering, our audit committee will be composed of David W. Truetzel (Chairman), B. Sonny Bal, M.D. and Max E. Link, Ph.D., each of whom is independent within the meaning of the rules of the SEC and the listing standards of The NASDAQ Capital Market. Our board of directors has determined Mr. Truetzel qualifies as a financial expert as defined in SEC rules. Our independent auditors and management periodically meet privately with our audit committee. Our audit committee is authorized to:
| • | approve and retain the independent auditors to conduct the annual audit of our books and records; |
| • | review the proposed scope and results of the audit; |
| • | review and pre-approve the independent auditor’s audit and non-audit services rendered; |
| • | approve the audit fees to be paid; |
| • | review accounting and financial controls with the independent auditors and our financial and accounting staff; |
| • | review and approve transactions between us and our directors, officers and affiliates; |
| • | recognize and prevent prohibited non-audit services; |
| • | establish procedures for complaints received by us regarding accounting matters; |
| • | oversee internal audit functions; and |
| • | prepare the report of the audit committee that SEC rules require to be included in our annual meeting proxy statement. |
Compensation Committee
The rules of The NASDAQ Capital Market require that the compensation committee consist of at least two members of our board of directors, each of whom must be independent, as established under the rules of The NASDAQ Capital Market and the SEC. At the closing of this offering, our compensation committee will be composed of Max E. Link, Ph.D. (Chairman), David W. Truetzel and B. Sonny Bal, M.D., each of whom is independent within the meaning of the rules of the SEC and The NASDAQ Capital Market.
Our compensation committee is authorized to:
| • | annually evaluate the performance of and review and recommend to our board of directors the compensation arrangements for management, including the compensation for our president and chief executive officer; |
| • | establish and review general compensation policies with the objective to attract and retain superior talent, to reward individual performance and to achieve our financial goals; |
| • | determine or review and make recommendations to our board of directors with respect to director compensation; |
98
| • | evaluate and assess potential compensation advisors and retain and approve their compensation; and |
| • | administer our stock incentive plans. |
Nominating and Governance Committee
At the closing of this offering, our nominating and governance committee will be composed of Max E. Link, Ph.D. (Chairman) and B. Sonny Bal, M.D., each of whom is independent within the meaning of the rules of the SEC and The NASDAQ Capital Market. Our nominating and governance committee is authorized to:
| • | develop and recommend to the board of directors criteria for board and committee membership; |
| • | establish procedures for identifying and evaluating board of director candidates, including nominees recommended by stockholders; |
| • | identify individuals qualified to become members of the board of directors and recommend such persons to the board of directors to be nominated for election as directors and/or to each of the board of directors’ committees; |
| • | develop and recommend to the board of directors a set of corporate governance principles applicable to our company; and |
| • | oversee the evaluation of the board of directors and management. |
Compensation Committee Interlocks and Insider Participation
No member of our compensation committee has at any time been an employee of ours. None of our executive officers serves as a member of the board of directors or compensation committee of any entity that has one or more executive officers serving as a member of our board of directors or compensation committee.
Code of Business Conduct and Ethics
We have adopted a code of business ethics that applies to all of our employees, officers and directors, including those officers responsible for financial reporting. Upon the closing of this offering, our code of business conduct and ethics will be available on our website. We intend to disclose any amendments to the code, or any waivers of its requirements on our website.
99
EXECUTIVE AND DIRECTOR COMPENSATION
The following discussion relates to the compensation of our “named executive officers,” including our Chief Executive Officer and President, Eric K. Olson, and our two most highly compensated executive officers (other than our chief executive officer), Jay M. Moyes, our Chief Financial Officer, and Bryan J. McEntire, our Chief Technology Officer.
Summary Compensation Table
The following table sets forth information about certain compensation awarded or paid to our named executive officers for the 2012 and 2013 fiscal years.
| Name and Principal Position |
Year | Salary ($) |
Bonus ($) |
Stock Awards ($)(1) |
Option Awards ($)(2) |
All
Other Compensation ($)(3) |
Total ($) |
|||||||||||||||||||||
| Eric K. Olson Chief Executive Officer and President |
|
2013 2012 |
|
|
315,192 240,423 |
|
|
— 20,000 |
|
|
442,000 — |
(4)
|
|
— 325,000 |
|
|
34,075 — |
(5) (6) |
|
791,267 585,423 |
| |||||||
| Jay M. Moyes Chief Financial Officer |
|
2013 2012 |
|
|
50,000 — |
(7)
|
|
100,000 — |
(8)
|
|
1,030,200 — |
(9)
|
|
— — |
|
|
30,288 8,043 |
(10) (11) |
|
1,210,488 8,043 |
| |||||||
| Bryan J. McEntire Chief Technology Officer |
|
2013 2012 |
|
|
228,543 217,995 |
|
|
— 5,000 |
|
|
299,200 — |
(12)
|
|
— 94,550 |
|
|
33,246 8,680 |
|
|
560,989 326,225 |
| |||||||
| (1) | Amounts shown reflect the aggregate grant date fair value of restricted stock units, or RSUs, granted to the named executive officer computed in accordance with the Financial Accounting Standards Board, Accounting Standards Codification Topic 718, Compensation — Stock Compensation, or FASB ASC Topic 718. These amounts may not correspond to the actual value that will be recognized by the named executive officers. The grant date fair value of performance-based RSUs is determined based on the probable outcome of such performance conditions as of the grant date. The grant date fair value of the performance-based RSUs assuming the maximum potential value that can be achieved is $442,000 for Mr. Olson, $1,030,200 for Mr. Moyes and $299,200 for Mr. McEntire. Assumptions used in the calculations of these amounts are included in Note 8 to our financial statements included elsewhere in this prospectus. |
| (2) | Amount shown for Mr. Olson reflects the grant date fair value of options awarded in 2012 determined in accordance with FASB ASC Topic 718. The amount shown for Mr. McEntire reflects the incremental fair value of stock options issued in exchange for outstanding stock options with exercise prices over $25.77 in March 2012. These amounts exclude the value of estimated forfeitures. Assumptions used in the calculations of these amounts are included in Note 8 to our financial statements included elsewhere in this prospectus. |
| (3) | Amount reflects the aggregation of any matching of 401(k) contributions, group term life premiums paid by us and accrued vacation in instances where each such amount is less than $10,000, unless otherwise noted. |
| (4) | Amount includes the grant date fair value of (i) 23,279 RSUs issued to Mr. Olson in exchange for the cancellation of options to purchase 23,279 shares of our common stock held by Mr. Olson and (ii) 1,940 RSUs that were issued to Mr. Olson in June 2013. |
| (5) | Includes $26,923 of accrued vacation. |
| (6) | Mr. Olson did not contribute money to our 401(k) plan in 2012. Therefore we paid no matching 401(k) amounts nor did we provide him with any other additional compensation in 2012. |
| (7) | Amount reflects the pro-rated amount of Mr. Moyes’s annual salary of $325,000 that was paid to Mr. Moyes since the beginning of his employment with us through the end of the 2013 fiscal year. |
| (8) | Amount reflects the signing bonus that was paid to Mr. Moyes upon the commencement of his employment. |
| (9) | Amount reflects the grant date fair value of (i) 58,197 RSUs that were issued to Mr. Moyes upon the commencement of his employment and (ii) 582 RSUs that were issued to Mr. Moyes as a non-employee director prior to the commencement of his employment. |
| (10) | Amount includes the $27,185 of board member attendance fees paid to Mr. Moyes for his service as a member of our board of directors prior to the commencement of his employment with us. |
| (11) | Amount reflects fees paid to Mr. Moyes for service on our board of directors in the 2012 fiscal year. |
| (12) | Amount reflects the grant date fair value of (i) 16,101 RSUs that were issued to Mr. McEntire in February 2013 in exchange for the cancellation of options to purchase 16,101 shares of our common stock held by him and (ii) 970 RSUs that were issued to Mr. McEntire in June 2013. |
100
Narrative Disclosure to Summary Compensation Table
Base Salaries. The base salaries for our named executive officers were determined by our compensation committee after reviewing a number of factors, including:
| • | the responsibilities associated with the position held by each of our executive officers and where that position fits within our overall corporate structure; |
| • | the seniority of the individual executive’s position; |
| • | the base salary level of each executive officer in prior years; |
| • | our overall financial position; and |
| • | for executive officers other than our Chief Executive Officer, recommendations made by our Chief Executive Officer. |
Our board of directors approved a salary of $250,000 for Mr. Olson and $228,545 for Mr. McEntire, effective as of January 1, 2012. Mr. Moyes was not employed by us at this time and as such received no compensation from us in 2012 other than fees for serving as a non-employee director. Our board of directors reduced the salaries of our named executive officers by ten percent effective as of May 31, 2012 in order to conserve cash. On December 12, 2012, Mr. McEntire’s salary was restored to its original 2012 amount and Mr. Olson’s salary was increased to $300,000. Our board, on the recommendation of our compensation committee decided to give this base salary increase to Mr. Olson in recognition of his significant contributions to our company, including helping to increase our revenue above $23.0 million, aligning our sales and marketing team’s salaries with our revenues and our receipt of 510(k) clearance for our second generation Valeo products while under his leadership. As a result of these salary changes in 2012, Messrs. Olson and McEntire received the following salary amounts:
| Name |
Initial Base Salary (1)($) |
10% Reduced Base Salary (2) |
Restored/New Base Salary (3) |
|||||||||
| Eric K. Olson |
250,000 | 225,000 | 300,000 | |||||||||
| Chief Executive Officer and President |
||||||||||||
| Bryan J. McEntire |
228,545 | 205,691 | 228,545 | |||||||||
| Chief Technology Officer |
||||||||||||
| (1) | Base salary from January 1, 2012 to May 31, 2012 |
| (2) | Base salary from June 1, 2012 to December 12, 2012 |
| (3) | Base salary as of December 12, 2012. |
Our board authorized salary increases for each of our named executive officers effective as of October 30, 2013. Accordingly, Mr. Olson’s salary was increased from $300,000 to $350,000, and Mr. McEntire’s salary was increased from $228,545 to $235,000. Mr. Moyes did not receive a salary increase as he had just began his employment with us at the time of salary increases.
Annual Cash Bonuses. We have historically awarded discretionary cash bonuses to our executive officers. These bonuses are intended to reward our executive officers for the achievement of key strategic and business outcomes. Accordingly, each of Messrs. Olson and McEntire was awarded a cash bonus for 2012 equal to $20,000 and $5,000, respectively. Mr. Moyes was not employed with us in 2012 and as such did not receive a cash bonus for 2012. Our compensation committee has established a set of corporate objectives pursuant to which they may award our executive officers cash bonuses for their performance during 2013. These cash bonuses are discretionary and the compensation committee has not yet decided whether or not cash bonuses will be awarded for 2013 performance.
Long-Term Incentives. All options granted to our executive officers have been granted under the 2003 Stock Option Plan, or the 2003 Plan. These options vest over a period of time, generally four years. Upon termination of employment for any reason other than cause, our vested stock options granted to our named executive officers do not terminate and instead remain outstanding for their full-term of ten years. In the future, our compensation committee, with the approval of our board and stockholders, may grant to our named executive officers under the Amended and Restated 2012 Equity Incentive Plan, or the 2012 Plan, incentive stock options, non-qualified stock options, restricted and unrestricted stock awards, or stock-based awards, including RSUs and other stock based awards. See “—Equity Incentive Plans—2012 Plan” below for additional details about the 2012 Plan.
101
In March 2012, our board approved the cancellation of stock options held by current employees and members of our board with exercise prices above $25.77 per share and replaced such options with new options for an equivalent number of shares with exercise prices of $25.77 per share and ten-year terms to expiration, which were fully vested as of the date of grant. Mr. McEntire exchanged 8,147 options for an equal number of options at this time. None of Mr. Olson’s options were cancelled because he held no options that had exercise prices over $25.77. Mr. Moyes was not a member of our board of directors or our employee at that time.
2013 Compensation.
In January 2013, we offered to each employee and director that held options to acquire shares of our common stock awarded under the 2003 Plan the opportunity to exchange such options for RSUs to be issued under the 2012 Plan on a one-for-one basis. As a result of the exchange offer, 93,968 RSUs were issued under the 2012 Plan in February 2013. Messrs. Olson and McEntire exchanged stock options and received 23,279 and 16,101 RSUs, respectively. Mr. Moyes did not have options eligible for conversion. The RSUs expire three years from the date of grant and will only vest upon (i) the date of expiration of the lock-up period imposed on the employees and directors after completion of the closing of an underwritten initial public offering of the shares of our common stock or (ii) the date of closing of a change in control provided, in each case, that the individual is providing services to us on such date.
In June 2013, in lieu of granting stock options, our board approved a grant of RSUs under the 2012 Plan to our named executive officers. Messrs. Olson and McEntire received 1,940 and 970 RSUs, respectively. The RSUs, which were awarded based on our 2012 performance, will vest upon (i) the date of expiration of the lock-up period imposed in connection with the closing of an underwritten initial public offering of shares of our common stock or (ii) the date of a closing of a change in control, in each case, provided that the executive officer is providing services to us on such date and such event occurs within three years from the grant date.
On October 27, 2013, our board approved the hiring of Mr. Moyes as our Chief Financial Officer at an annual base salary of $325,000 and provided Mr. Moyes with a signing bonus of $100,000 which was paid on his first day of employment. In addition, if Mr. Moyes’s employment is terminated by us for any reason other than cause, he shall be entitled to receive a pro-rated portion of his annual bonus for the year in which the termination occurs. In connection with his hiring, our board approved a grant of 58,197 RSUs to Mr. Moyes under the 2012 Plan, of which (i) 19,399 RSUs vested on his first day of employment, (ii) 19,399 RSUs vested on January 27, 2014 and (iii) 19,399 RSUs vested upon the pricing of our initial public offering. In addition, the release date of the shares for any vested RSUs will be postponed until the first to occur of (i) a change in control or (ii) a separation of Mr. Moyes’s service with us for any reason in compliance with Section 409A of the Internal Revenue Code.
2014 Compensation
On January 27, 2014, our board approved grants of RSUs to our named executive officers in the aggregate amount of 807,965 shares, as detailed below, subject to stockholder approval of an amendment to the 2012 Plan to increase the number of shares authorized for issuance under the 2012 Plan, to be issued on the earlier of (i) a change in control and (ii) the effectiveness of a registration statement on Form S-8 which registers the shares underlying the RSUs:
| Name and Title |
Grant Amount | |
| Eric K. Olson Chief Executive Officer and President |
417,077 | |
| Jay M. Moyes Chief Financial Officer |
299,713 | |
| Bryan J. McEntire Chief Technology Officer |
91,175 |
102
Outstanding Equity Awards at Fiscal Year-End
The following table shows information regarding equity awards held by our named executive officers as of December 31, 2013.
| Option Awards | Stock Awards | |||||||||||||||||||||||
| Name |
Number of Securities Underlying Unexercised Options (#) Exercisable |
Number of Securities Underlying Unexercised Options (#) Unexercisable |
Option Exercise Price ($) |
Option Expiration Date |
Equity Incentive Plan Awards: Number of Unearned Shares, Units, or Other Rights That Have Not Vested (#)(1) |
Equity Incentive Value of Unearned Market or Payout Value of Unearned Shares, Units or Other Rights That Have Not Vested ($)(2) |
||||||||||||||||||
| Eric K. Olson |
— | — | — | — | 25,219 | 442,000 | ||||||||||||||||||
| Chief Executive Officer and President |
||||||||||||||||||||||||
| Jay M. Moyes |
— | — | — | — | 39,380 | 690,200 | ||||||||||||||||||
| Chief Financial Officer |
||||||||||||||||||||||||
| Bryan J. McEntire |
7,760 | — | 6.44 | 6/8/2014 | 17,071 | 299,200 | ||||||||||||||||||
| Chief Technology Officer |
||||||||||||||||||||||||
| (1) | RSUs vest upon the earlier to occur of (i) date of expiration of the lock-up imposed on the employees and directors after completion of the closing of an underwritten initial public offering of the shares of our common stock or (ii) the date of a closing of a change in control provided, in each case, that the individual providing services to us on such date, and expire three years after the date of grant. |
| (2) | Reflects the value calculated by multiplying the number of unvested RSUs by the value of our common stock on December 31, 2013, which we estimate was approximately $17.53. |
Retirement Benefits
401(k) Plan
Our employee savings plan is a tax-qualified profit sharing plan that includes a “cash-or-deferred” (or 401(k)) feature. The plan is intended to satisfy the requirements of Section 401 of the Internal Revenue Code. Our employees may elect to reduce their current compensation by up to the statutorily prescribed annual limit and have a like amount contributed to the plan. In addition, we may make discretionary and/or matching contributions to the plan in amounts determined annually by our board. We currently elect to match the contributions of our employees who participate in our 401(k) plan as follows: a match of 100% on the first 3% of compensation contributed by a plan participant and a match of 50% on amounts above 3%, up to 5%, of compensation contributed by a plan participant. In 2013, our employer contribution to the plan was $158,419.
Potential Payments Upon Termination or Change in Control
We have entered into certain agreements and maintain certain plans that may require us to make certain payments and/or provide certain benefits to the executive officers named in the Summary Compensation Table in the event of a termination of employment or change in control.
Pursuant to severance agreements that we have entered into with each of our named executive officers (other than Mr. Moyes, who would receive severance payments pursuant to the terms of his employment agreement as more fully described below), upon the consummation of a change in control, all outstanding options, restricted stock and other such rights held by the executives will fully vest. Additionally, if a change in control occurs and at any time during the one-year period following the change in control (i) we or our successor terminate the executive’s employment other than for cause (but not including termination due to the executive’s death or disability) or (ii) the executive terminates his employment for good reason, then such executive has the right to receive payment consisting of a lump sum payment equal to two times his highest annual salary with us during the preceding three-year period, including the year
103
of such termination and including bonus payments (measured on a fiscal year basis), but not including any reimbursements and amounts attributable to stock options and other non-cash compensation. “Change in control” is defined in the severance agreements as occurring upon: (i) any “person” (as such term is used in Sections 13(d) and 14(d) of the Exchange Act) becoming the “beneficial owner” (as defined in Rule 13d-3 under the Exchange Act), directly or indirectly, of securities representing 50% or more of the total voting power represented by our then outstanding voting securities (excluding securities held by us or our affiliates or any of our employee benefit plans) pursuant to a transaction or a series of related transactions which our board did not approve; (ii) a merger or consolidation of our company, other than a merger or consolidation which would result in our voting securities outstanding immediately prior thereto continuing to represent at least 50% of the total voting securities or such surviving entity or parent of such corporation outstanding immediately after such merger or consolidation; or (iii) the approval by our stockholders of an agreement for the sale or disposition of all or substantially all of our assets. As defined in the severance agreements, “cause” means: (i) the executive’s commission of a felony (other than through vicarious liability or through a motor vehicle offense); (ii) the executive’s material disloyalty or dishonesty to us; (iii) the commission by the executive of an act of fraud, embezzlement or misappropriation of funds; (iv) a material breach by the executive of any material provision of any agreement to which the executive and we are party, which breach is not cured within 30 days after our delivery to the executive of written notice of such breach; or (v) the executive’s refusal to carry out a lawful written directive from our board. “Good reason” as defined in the severance agreements means, without the executive’s consent: (i) a change in the principal location at which the executive performs his duties to a new work location that is at least 50 miles from the prior location; or (ii) a material change in the executive’s compensation, authority, functions, duties or responsibilities, which would cause his position with us to become of less responsibility, importance or scope than his prior position, provided, however, that such material change is not in connection with the termination of the executive’s employment with us for any reason.
In the event that an officer entitled to receive or receives payment or benefit under the severance agreements described above, or under any other plan, agreement or arrangement with us, or any person whose action results in a change in control or any other person affiliated with us and it is determined that the total amount of payments will be subject to excise tax under Section 4999 of the Internal Revenue Code, or any similar successor provisions, we will be obligated to pay such officer a “gross up” payment to cover all taxes, including any excise tax and any interest or penalties imposed with respect to such taxes due to such payment.
Pursuant to the terms of Mr. Moyes’s employment arrangement, upon the occurrence of a change in control, all RSUs granted to Mr. Moyes at the time of his employment will fully vest. Pursuant to the employment arrangement, if: (i) Mr. Moyes is terminated by us without cause, (ii) he terminates his employment for good reason, or (iii) in the event a change in control occurs and Mr. Moyes is not offered continuing employment by the acquiring company or if such continuing employment is terminated without cause or if he terminates such continuing employment with good reason at any time during the twelve months following the change in control, we will be required to pay Mr. Moyes a lump sum equal to the sum of: (i) two times his annual salary in effect on the date of termination, (ii) any unpaid bonus through the end of his employment for the prior year that had been earned by Mr. Moyes but not paid plus a pro rata portion of his performance bonus and (iii) two times his sign on bonus. In addition, provided Mr. Moyes properly elects for continuation coverage, we will pay health insurance premiums for Mr. Moyes, his spouse and any covered dependents for a period of 24 months following the termination of his employment. Pursuant to the terms of the employment arrangement, “good reason” means, without Mr. Moyes’s consent, the occurrence of any one or more of the following events: (i) a material diminution of Mr. Moyes’s authority, functions, duties or responsibilities; (ii) a relocation of Mr. Moyes’s principal workplace to a new location more than 50 miles from the prior location; (iii) the material diminution of Mr. Moyes’s annual base salary, other than in the event of a reduction in compensation of all of our executive officers, generally, so long as the reduction to Mr. Moyes’s base salary is no more than the average reduction; or (iv) a material breach by us of the terms of the employment agreement. “Change in control” has the same meaning as previously described under the severance agreements for the other executive officers.
In connection with a change in control, if Mr. Moyes will be required to pay any excise tax pursuant to Section 4999 of the Internal Revenue Code or any similar successor provisions then we will make an additional “gross up” payment to Mr. Moyes in an amount to cover such excise tax and the taxes associated with each payment.
104
Equity Incentive Plans
2003 Plan
The 2003 Plan was approved by our board and our stockholders on August 3, 2003 and terminated in September 2012. As such, no additional awards may be made under the 2003 Plan. The 2003 Plan provided for the granting of incentive stock options and NQSOs to our employees, officers, directors and consultants. As of September 30, 2013, there were options to purchase 93,220 shares of our common stock outstanding under the 2003 Plan.
Plan Administration. Our board is the administrator of the 2003 Plan, except that it may also delegate such authority to a committee of the board, in which case the committee shall be the administrator. Our board has delegated authority to administer the 2003 Plan to the compensation committee.
Termination of Service. Unless otherwise provided in an award agreement, upon a termination of a participant’s service for cause (as defined in the 2003 Plan), all options then held by the participant will terminate. Upon termination, vested options remain outstanding for their full ten year term.
Transferability. Generally, awards under the 2003 Plan may not be transferred except by will or by the laws of descent and distribution. However, NQSOs may be transferred for no consideration for the benefit of a participant’s immediate family.
Adjustment. In the event of a stock dividend, stock split, recapitalization or reorganization or other change in capital structure, the 2003 Plan administrator will make appropriate adjustments to the number and kind of shares of stock or securities subject to outstanding options.
Corporate Transaction. Unless otherwise provided in a participant’s award agreement, if we are acquired, the administrator of the 2003 Plan may provide for the substitution of all the outstanding option awards by the acquiring or surviving entity. If the awards are not so assumed or substituted, each stock option may, upon written notice to the participants, vest (either to the extent exercisable or at the discretion of the administrator, or upon a change in control, in full) and become fully exercisable. Otherwise, the administrator may terminate all outstanding options in exchange for cash payment equal to the excess of the fair market value of the shares subject to such options (either to the extent exercisable or at the discretion of our compensation committee, or upon a change in control, in full) over the exercise price of such options.
Amendment of Outstanding Options. The administrator may amend any term or condition of an outstanding option provided that any such amendment shall be made only with the consent of the participant if the amendment is adverse to the participant.
2012 Plan
In September 2012, our board adopted the 2012 Plan and reserved for issuance under the 2012 Plan the aggregate sum of (i) 155,192 shares of our common stock and (ii) any shares of our common stock represented by awards granted under the 2003 Plan that are forfeited, expire or are cancelled without delivery of shares of our common stock after September 6, 2012. Subject to adjustment, as of September 30, 2013, the maximum number of shares that could be delivered in satisfaction of awards under the 2012 Plan was 292,274 shares. The 2012 Plan is intended to encourage ownership of common stock by our employees and directors and certain of our consultants in order to attract and retain such people, to induce them to work for the benefit of us and to provide additional incentive for them to promote our success. In November 2013 and January 2014, our board approved amendments to the 2012 Plan, subject to stockholder approval, to become effective upon the completion of the initial public offering of shares of our common stock. Pursuant to the amendments, the number of shares of our common stock reserved for issuance under the 2012 Plan will be 3,000,000, which number shall be automatically increased on January 1 of each of year by the lesser of (i) 5% of the number of outstanding shares of our common stock on such date, (ii) 5% of the number of outstanding shares upon the completion of our initial public offering of shares our common stock, and (iii) such other amount determined by the board through the termination of the 2012 Plan. Upon the completion of this offering, 1,594,170 shares of common stock issuable upon the vesting of RSUs will be outstanding under the 2012 Plan.
105
Types of Awards. The 2012 Plan provides for the granting of incentive stock options, NQSOs, stock grants and other stock-based awards, including RSUs.
| • | Incentive and Nonqualified Stock Options. The plan administrator determines the exercise price of each stock option. The exercise price of an NQSO may not be less than the fair market value of our common stock on the date of grant. The exercise price of an incentive stock option may not be less than the fair market value of our common stock on the date of grant if the recipient holds 10% or less of the combined voting power of our securities, or 110% of the fair market value of a share of our common stock on the date of grant otherwise. |
| • | Stock Grants. The plan administrator may grant or sell stock, including restricted stock, to any participant, which purchase price, if any, may not be less than the par value of shares of our common stock. The stock grant will be subject to the conditions and restrictions determined by the administrator. The recipient of a stock grant shall have the rights of a stockholder with respect to the shares of stock issued to the holder under the 2012 Plan. |
| • | Stock-Based Awards. The administrator of the 2012 Plan may grant other stock-based awards, including stock appreciation rights, phantom stock awards and RSUs, with terms approved by the administrator, including restrictions related to the awards. The holder of a stock-based award shall not have the rights of a stockholder until shares of our common stock are issued pursuant to such award. |
Plan Administration. Our board is the administrator of the 2012 Plan, except to the extent it delegates its authority to a committee, in which case the committee shall be the administrator. Our board has delegated this authority to our compensation committee. The administrator has the authority to determine the terms of awards, including exercise and purchase price, the number of shares subject to awards, the value of our common stock, the vesting schedule applicable to awards, the form of consideration, if any, payable upon exercise or settlement of an award and the terms of award agreements for use under the 2012 Plan.
Eligibility. Our board will determine the participants in the 2012 Plan from among our employees, directors and consultants. A grant may be approved in advance with the effectiveness of the grant contingent and effective upon such person’s commencement of service within a specified period.
Termination of Service. Unless otherwise provided by our board or in an award agreement, upon a termination of a participant’s service, all unvested options then held by the participant will terminate and all other unvested awards will be forfeited.
Transferability. Awards under the 2012 Plan may not be transferred except by will or by the laws of descent and distribution, unless otherwise provided by our board in its discretion and set forth in the applicable agreement, provided that no award may be transferred for value.
Adjustment. In the event of a stock dividend, stock split, recapitalization or reorganization or other change in change in capital structure, our board will make appropriate adjustments to the number and kind of shares of stock or securities subject to awards.
Corporate Transaction. If we are acquired, our board of directors (or compensation committee) will: (i) arrange for the surviving entity or acquiring entity (or the surviving or acquiring entity’s parent company) to assume or continue the award or to substitute a similar award for the award; (ii) cancel or arrange for cancellation of the award, to the extent not vested or not exercised prior to the effective time of the transaction, in exchange for such cash consideration, if any, as our board of directors in its sole discretion, may consider appropriate; or (iii) make a payment, in such form as may be determined by our board of directors equal to the excess, if any, of (A) the value of the property the holder would have received upon the exercise of the award immediately prior to the effective time of the transaction, over (B) any exercise price payable by such holder in connection with such exercise. In addition in connection with such transaction, our board of directors may accelerate the vesting, in whole or in part, of the award (and, if applicable, the time at which the award may be exercised) to a date prior to the effective time of such transaction and may arrange for the lapse, in whole or in part, of any reacquisition or repurchase rights held by us with respect to an award.
106
Amendment and Termination. The 2012 Plan will terminate on September 6, 2022 or at an earlier date by vote of the stockholders or our board; provided, however, that any such earlier termination shall not affect any awards granted under the 2012 Plan prior to the date of such termination. The 2012 Plan may be amended by our board, except that our board may not alter the terms of the 2012 Plan if it would adversely affect a participant’s rights under an outstanding stock right without the participant’s consent. Stockholder approval will be required for any amendment to the 2012 Plan to the extent such approval is required by law, include the Internal Revenue Code or applicable stock exchange requirements.
Amendment of Outstanding Awards. The administrator may amend any term or condition of any outstanding award including, without limitation, to reduce or increase the exercise price or purchase price, accelerate the vesting schedule or extend the expiration date, provided that no such amendment shall impair the rights of a participant without such participant’s consent.
2013 Employee Stock Purchase Plan
Our board of directors approved our 2013 Employee Stock Purchase Plan, or our 2013 ESPP, in November 2013. Our 2013 ESPP will become effective on a date to be determined by our board of directors following the date on which this registration statement is declared effective. On January 27, 2014, our board voted to increase the number of shares of our common stock reserved for issuance under the 2013 ESPP.
A total of 170,000 shares of our common stock will be initially authorized and reserved for sale under our 2013 ESPP. In addition, our 2013 ESPP provides for an automatic annual increase in the number of shares available for issuance under the plan on January 1 of each year beginning in 2015 and continuing through and including January 1, 2023 equal to the lesser of (i) 170,000 shares, (ii) 1.5% of our then issued and outstanding shares of our common stock on the immediately preceding December 31, or (iii) a number of shares as our board of directors may determine.
Plan Administration. Our board of directors will administer our 2013 ESPP and will have the authority to construe and interpret the terms of our 2013 ESPP and any awards granted under it.
Eligibility. Our employees and employees of any subsidiary corporation designated by our board of directors are eligible to participate in our 2013 ESPP if they are customarily employed by us for more than 20 hours per week and more than five months in any calendar year. However, an employee may not be granted a right to purchase stock under our 2013 ESPP if: (i) the employee immediately after such grant would own stock possessing 5% or more of the total combined voting power or value of all classes of our capital stock or of any subsidiary corporation, (ii) the employee’s rights to purchase stock under all of our employee stock purchase plans would accrue at a rate that exceeds $25,000 in value for each calendar year of participation in such plans, or (iii) the employee right to purchase shares of our common stock in a single offering period exceeds the number of shares calculated by dividing $50,000 by the fair market value of shares of our common stock on the first day of the offering period.
Plan Structure. Our 2013 ESPP is generally designed to comply with the provisions of Section 423 of the Internal Revenue Code and will typically be implemented through a series of sequential offering periods, generally six months in duration, as established by our board of directors. In addition, our board of directors may establish an offering period to commence on the effective date of our 2013 ESPP of such duration as our board of directors may determine (subject to restrictions imposed by applicable law).
Amounts accumulated for each participant, generally through payroll deductions, are credited toward the purchase of shares of our common stock at the end of each offering period at a price generally equal to 85% of the lower of the fair market value of our common stock at the beginning of the offering period or on the purchase date (which will typically be at the end of an offering period).
If insufficient shares remain available under the plan to permit all participants to purchase the number of shares to which they would otherwise be entitled, our compensation committee will make a pro rata allocation of the available shares. Any amounts withheld from participants’ compensation in excess of the amounts used to purchase shares will be refunded.
107
Corporate Transaction. In the event of any merger, consolidation, sale of substantially all of our assets or capital reorganization with or into another corporation, an acquiring or successor corporation shall, unless otherwise determined by our board of directors, assume or substitute the shares issuable pursuant under our 2013 ESPP into equivalent shares issuable of the capital stock of the acquiring corporation, its parent or subsidiary. Alternatively, our board of directors may, in its sole discretion and in lieu of such assumption or substitution, shorten the offering period then in progress and set a new exercise date to a date prior to the change in control as specified by our board of directors.
Amendment and Termination. Our board of directors has the authority to amend, suspend or terminate our 2013 ESPP, except that, subject to certain exceptions described in the 2013 ESPP, no such action may adversely affect any outstanding rights to purchase stock under our 2013 ESPP.
Director Compensation
The following table shows the total compensation paid or accrued during the fiscal year ended December 31, 2013 to each of our non-employee directors except Mr. Jeffrey S. White who was not a member of our board of directors in 2013. Fees paid to Mr. Moyes for his service as a director prior to his employment with us are included in the Summary Compensation Table.
| Fees Earned or Paid in Cash($) |
Stock
Awards ($)(1)(2) |
Option
Grants ($)(3) |
All
Other Compensation ($) |
Total ($) |
||||||||||||||||
| Name |
||||||||||||||||||||
| Max E. Link, Ph.D. |
38,500 | 10,200 | — | — | 48,700 | |||||||||||||||
| B. Sonny Bal, M.D. |
26,000 | 10,200 | — | — | 36,200 | |||||||||||||||
| Gregg R. Honigblum(4) |
24,151 | 10,200 | — | — | 34,351 | |||||||||||||||
| Rohit Patel(5) |
30,909 | 10,200 | — | 12,250 | (6) | 53,359 | ||||||||||||||
| George Singer(7) |
17,522 | 10,200 | — | — | 27,722 | |||||||||||||||
| David Truetzel |
43,751 | 10,200 | — | — | 53,951 | |||||||||||||||
| (1) | As part of the annual grant to directors, each director received 582 RSUs. These RSUs expire three years from the date of grant and will only vest upon (a) the earlier of the date of expiration of the lock-up period imposed in connection with the closing of an underwritten initial public offering of shares of our common stock or (b) the date of a closing of a change of control provided, in either case, that the applicable vesting event occurs prior to June 30, 2014. |
| (2) | Amount shown reflects the grant date fair value of the RSUs awarded in 2013 determined in accordance with the Financial Accounting Standards Board, Accounting Standards Codification Topic 718, Compensation-Stock Compensation. Assumptions used in the calculation of these amounts are included in Note 8 to our financial statements included elsewhere in this prospectus. |
| (3) | No stock options were granted to directors during 2013. However, as of December 31, 2013, our directors held the following aggregate number of stock options: Dr. Link, 3,783; Dr. Bal, 2,813; and Mr. Honigblum, 4,171. Mr. Singer, did not hold any stock options as of December 31, 2013. All stock options are fully vested. |
| (4) | Mr. Honigblum resigned from our board of directors in September 2013. |
| (5) | Mr. Patel resigned from our board of directors in September 2013. |
| (6) | We paid Mr. Patel $12,250 in consulting fees related to a litigation matter against our former Chief Executive Officer, Ben Shappley, in 2013. |
| (7) | Mr. Singer resigned from our board of directors in September 2013. |
We compensate each of the non-employee members of our Board in accordance with the following annual retainer and meeting fees (paid on a quarterly basis):
| • Board member Annual Retainer |
$ | 20,000 | ||
| • Board Chair Annual Additional Retainer |
$ | 10,000 | ||
| • Committee Chair Annual Retainer |
$ | 7,500 | ||
| • Committee member Annual Retainer |
$ | 3,750 | ||
| • Board meeting-in person attendance |
$ | 1,500 | ||
| • Board meeting-telephonic attendance |
$ | 1,000 | ||
| • Committee meeting attendance |
$ | 1,500 | ||
| • Committee meeting-telephonic attendance |
$ | 1,000 |
In addition to cash compensation, the non-employee members of our Board have historically been awarded an annual stock option grant in the amount of 582 shares of our common stock. In 2013, in lieu of stock options, non-employee members of the board were each granted 582 RSUs. In January 2013, we offered to each director that held options to acquire shares awarded under the 2003 Plan the opportunity to exchange such options for an
108
equal number of RSUs. Messrs. Patel and Truetzel each exchanged stock options and received 9,021 RSUs and 2,716 RSUs, respectively, under the 2012 Plan. These RSUs expire three years from the date of grant and will only vest upon continued service with us and if either of the following events occurs prior to the expiration date: (i) the date of the expiration of the lock-up period imposed on the directors after completion of the closing of an underwritten initial public offering of the shares of our commons stock or (ii) upon a change in control (as defined in the 2012 Restricted Stock Unit Agreement).
109
CERTAIN RELATIONSHIPS AND RELATED PARTY TRANSACTIONS
The following includes a summary of transactions since January 1, 2010 to which we have been a party, in which the amount involved in the transaction exceeded $120,000, and in which any of our directors, executive officers or, to our knowledge, beneficial owners of more than 5% of our common stock, on an as converted basis, or any member of the immediate family of any of the foregoing persons had or will have a direct or indirect material interest, other than equity and other compensation, termination, change in control and other arrangements, which are described under “Executive and Director Compensation.” With the approval of our board of directors, we have engaged in the transactions described below with our directors, executive officers and beneficial owners of more than 5% of our common stock, on an as converted basis, and affiliates of our directors, executive officers and 5% stockholders.
Acquisition of US Spine, Inc. and Transactions with MSK Investments, LLC and its Affiliates
Acquisition of US Spine, Inc.
In September 2010, we acquired US Spine, Inc., or US Spine. In this transaction, US Spine became our wholly owned subsidiary as we acquired all of the outstanding capital stock of US Spine for up to $42.6 million payable by the following:
| • | the issuance of 7,150,000 shares of our Series E convertible preferred stock, of which 333,750 shares were paid to Spinal Management LLC an advisor of US Spine as a transaction fee payment and 1,806,250 shares were placed in an escrow to cover indemnification claims under the acquisition agreement; |
| • | the issuance of up to 6,250,000 shares of our Series E convertible preferred stock upon the achievement of certain earnout milestones, which we refer to as the US Spine Earnout; |
| • | the issuance of up to 350,000 shares of our Series E convertible preferred stock if we did not issue certain US Spine sales agents a specified number of warrants to purchase our common stock within three years after the closing of the acquisition; and |
| • | the payment of $15.1 million in cash to certain debt holders of US Spine, including $9.1 million paid at closing and $6.0 million payable pursuant to a promissory note, or the US Spine Note, issued in favor of MSK Investments, LLC, or MSK. The US Spine Note was payable in two installments of $3.0 million payable in September 2011 and September 2012, provided, that $1.0 million of the first installment was payable if we raised $20.0 million or more in equity financing before September 2011. |
As a result of this transaction, MSK, a company controlled by James G. Koman, together with its affiliates, became a beneficial owner of more than 5% of our common stock, on an as converted basis, and David Truetzel, a 50% co-owner of Spinal Management LLC, became a member of our board of directors. MSK and its affiliates received 5,127,353 shares of our Series E convertible preferred stock, $244,000 in cash and the US Spine Note. Mr. Truetzel received $90,000 for past services to US Spine and 50% interest in the shares of our Series E convertible preferred stock issued to, and a $667,500 cash payment made to Spinal Management LLC.
Settlement Agreement with MSK Investments, LLC
In May 2012, we entered into a settlement agreement with Mr. Koman and MSK, on its own behalf and acting in its capacity as stockholders’ representative for the former stockholders of US Spine, to resolve certain disputes. Pursuant to the settlement agreement, in lieu of the US Spine Earnout, we issued (a) 842,443 shares of our Series E convertible preferred stock to the former stockholders of US Spine, of which 39,249 shares were issued to MSK and its affiliates, and (b) 2,557,562 shares of our Series C convertible preferred stock to MSK. We also agreed to release the 1,806,250 shares of our Series E convertible preferred stock from escrow, of which 1,380,654 were received by MSK and its affiliates. MSK and Mr. Koman also agreed to certain standstill covenants in our favor that expire on May 10, 2015. Spinal Management LLC also received a commission that was paid in 42,122 and 127,878 of the shares of our Series E convertible preferred stock and Series C convertible preferred stock, respectively, issued under the settlement agreement.
110
Restructuring and Payment of the US Spine Note
In October 2012, we restructured the terms of the US Spine Note to extend the maturity date of the second $3.0 million installment from September 2012 to December 2012. We made payments to MSK of $500,000 on October 31, 2012 and $2,500,000 on December 17, 2012 in connection with this restructuring.
Private Placement of Series E Convertible Preferred Stock
Between March 2010 and July 2010, we issued an aggregate of 7,209,273 shares of our Series E convertible preferred stock at a purchase price of $2.00 per share to 147 accredited investors, including an aggregate of 1,706,396 shares to the following directors, officers and beneficial owners of more than 5% of our common stock, on an as converted basis, and their affiliates:
| Name |
Number of Shares of Series E Convertible Preferred Stock |
Aggregate Purchase Price | ||||||
| Max E. Link, Ph.D. |
25,000 | $ | 50,000 | |||||
| B. Sonny Bal, M.D.(1) |
115,000 | $ | 230,000 | |||||
| Rohit Patel(2) |
13,125 | $ | 26,250 | |||||
| Gregg R. Honigblum(3) |
56,250 | $ | 112,500 | |||||
| George A. Singer(4) |
125,062 | $ | 250,125 | |||||
| Karl Kipke(5) |
319,542 | $ | 639,084 | |||||
| Kevin Murphy |
112,500 | $ | 225,000 | |||||
| Allan R. Lyons(6) |
939,917 | $ | 1,879,834 | |||||
| (1) | Includes 90,000 shares that were jointly issued to Dr. Bal and his spouse, as well as 12,500 shares that were issued to Dr. Bal’s father, and 12,500 shares that were issued to Dr. Bal’s brother. |
| (2) | Shares are held by The Patel Family Trust U/A/D November 7, 1996, of which Mr. Patel and his spouse are the sole beneficiaries. Mr. Patel resigned from our board of directors in September 2013. |
| (3) | Includes 50,000 shares that were issued to Mr. Honigblum and 50% of the 12,500 shares that were issued to Creation Capital, LLC (“Creation Capital”), of which Mr. Honigblum is a 50% owner. Mr. Honigblum is a managing member of Creation Capital. Mr. Honigblum resigned from our board of directors in September 2013. |
| (4) | Consists of 50% of the 250,125 shares issued to Singer Bros. LLC, of which Mr. Singer is a 50% owner. Mr. Singer is a managing member of Singer Bros. LLC. Mr. Singer resigned from our board of directors in September 2013. |
| (5) | Shares were issued to Hampshire Healthcare Partners, LP. Hampshire Special Opportunities, LLC (“Special Opportunities”) is the general partner of Hampshire Healthcare Partners, LP. Mr. Kipke is the managing member of Special Opportunities. |
| (6) | Includes 879,357 shares that were issued to Vestal Venture Capital, LP (“Vestal”) and 60,560 shares that were issued to Lyonshare Venture Capital LP (“Lyonshare”). Mr. Lyons is the managing member and sole owner of 21st Century Strategic Investment Planning, LLC, the general partner of both Vestal and Lyonshare. |
111
Investors participating in the February 2010 closing that purchased at least 12,500 shares of our Series E convertible preferred stock had the right to convert, on a one-for-one basis, shares of our previously issued Series A convertible preferred stock, Series B convertible preferred stock, Series C convertible preferred stock and Series D convertible preferred stock already owned by the investor into a corresponding new series of our convertible preferred stock with a more favorable conversion rate. Directors, officers and beneficial owners of more than 5% of our common stock, on an as converted basis, and their affiliates participated in this conversion right as follows:
| Name |
Number of Shares of Series A-1 Convertible Preferred Stock |
Number of Shares of Series B-1 Convertible Preferred Stock |
Number of Shares of Series C-1 Convertible Preferred Stock |
Number of Shares of Series D-1 Convertible Preferred Stock |
||||||||||||
| Max E. Link, Ph.D. |
333,334 | — | — | — | ||||||||||||
| B. Sonny Bal, M.D.(1) |
— | 300,000 | 100,000 | 120,000 | ||||||||||||
| Rohit Patel(2) |
— | — | — | 35,000 | ||||||||||||
| Gregg R. Honigblum(3) |
530,500 | 92,890 | — | — | ||||||||||||
| George A. Singer(4) |
— | — | — | 333,500 | ||||||||||||
| Karl Kipke(5) |
— | — | — | 181,000 | ||||||||||||
| Kevin Murphy |
— | — | 150,000 | 290,500 | ||||||||||||
| Allan R. Lyons(6) |
1,403,854 | 851,251 | 1,112,500 | 1,110,000 | ||||||||||||
| (1) | Includes 300,000 Series B-1 shares and 120,000 Series D-1 shares that were jointly issued to Dr. Bal and his spouse and 50,000 Series C-1 shares that were issued to each of Dr. Bal’s father and brother. |
| (2) | Shares were issued to The Patel Family Trust U/A/D November 7, 1996, of which Mr. Patel and his spouse are the sole beneficiaries. Mr. Patel resigned from our board of directors in September 2013. |
| (3) | Includes 468,000 Series A-1 shares and 92,980 Series B-1 shares issued to Mr. Honigblum and 50% of the 125,000 Series A-1 shares that were issued to Creation Capital. Mr. Honigblum is a 50% owner and a managing member of Creation Capital. Mr. Honigblum resigned from our board of directors in September 2013. |
| (4) | Includes 50% of the 667,000 shares issued to Singer Bros. LLC. Mr. Singer is a 50% owner and a managing member of Singer Bros. LLC. Mr. Singer resigned from our board of directors in September 2013. |
| (5) | Shares were issued to Hampshire Healthcare Partners, LP. Special Opportunities is the general partner of Hampshire Healthcare Partners, LP. Mr. Kipke is the managing member of Special Opportunities. |
| (6) | Includes 898,491 Series A-1 shares that were issued to Vestal and 505,363 Series A-1 shares that were issued to Lyonshare; 705,238 Series B-1 shares that were issued to Vestal and 146,013 Series B-1 shares held by Lyonshare; and 1,122,500 shares of Series C-1 shares and 1,110,000 shares of Series D-1 shares that were issued to Vestal. Mr. Lyons is the managing member and sole owner of 21st Century Strategic Investment Planning, LLC, the general partner of both Vestal and Lyonshare. |
112
Private Placement of Senior Secured Subordinated 6%/8% Convertible Promissory Notes
Between March 2011 and May 2011, we issued an aggregate principal amount of $24.8 million of Senior Secured Subordinated 6%/8% Convertible Promissory Notes, or the Senior Secured Notes, and warrants to purchase 288,685 shares of our common stock at an exercise price of $51.55 per share to 85 accredited investors. In connection with the initial closing of this offering, we received a commitment from Hampshire Med Tech Partners, LP to purchase an additional $5.0 million Senior Secured Note by no later than the first anniversary of the initial closing (upon 30 days written notice to fund). Pursuant to this commitment, we issued an additional $5 million Senior Secured Note in February 2012. We issued an aggregate principal amount of $12,262,500 of our Senior Secured Notes and warrants to purchase up to 118,936 shares of our common stock to the following directors, officers and beneficial owners of more than 5% of our common stock, on an as converted basis and their affiliates:
| Name |
Principal Amount of Senior
Secured |
Common Stock Warrants |
||||
| Max E. Link Ph.D. |
$50,000 | 484 | ||||
| David Truetzel(1) |
$25,000 | 242 | ||||
| Allan R. Lyons(2) |
$950,000 | 9,214 | ||||
| Gregg R. Honigblum(3) |
$12,500 | 121 | ||||
| Karl Kipke(4) |
$10,000,000 | 96,994 | ||||
| B. Sonny Bal, M.D.(5) |
$25,000 | 242 | ||||
| Kevin Murphy |
$1,200,000 | 11,639 | ||||
| (1) | Includes a Senior Secured Note and common stock warrant issued to Truetzel Revocable Trust, of which Mr. Truetzel and his spouse are the sole beneficiaries. |
| (2) | Senior Secured Note and common stock warrant issued to Vestal. Mr. Lyons is the managing member and sole owner of 21st Century Strategic Investment Planning, LLC, the general partner of Vestal. |
| (3) | Consists of 50% of the principal amount of a Senior Secured Note and common stock warrant issued to Creation Capital. Mr. Honigblum is a 50% owner and a managing member of Creation Capital. Mr. Honigblum resigned from our board of directors in September 2013. |
| (4) | Senior Secured Notes and common stock warrants issued to Hampshire Med Tech Partners, LP, in which Mr. Kipke has an ownership interest. Mr. Kipke is the managing member of Hampshire Med Tech Partners, GP, LLC (“Hampshire Med Tech”), its general partner. |
| (5) | Senior Secured Note and common stock warrant issued to Dr. Bal’s father. |
113
Restructuring and Conversion of Senior Secured Subordinated 6%/8% Convertible Promissory Notes
In December 2012, we amended the terms of our Senior Secured Notes and the holders thereof converted all of their Senior Secured Notes into an aggregate of 14,887,500 shares of our Series F convertible preferred stock. We also amended the terms of the warrants issued in connection with the issuance of the Senior Secured Notes to lower the exercise prices thereof from $2.00 per share to $1.00 per share. As a result, we issued an aggregate of 6,131,250 shares of our Series F convertible preferred stock to the following directors, officers and beneficial owners of more than 5% of our common stock, on an as converted basis, and their affiliates:
| Name |
Number of Shares of Series
F Convertible Preferred Stock | |
| Max E. Link, Ph.D. |
25,000 | |
| David Truetzel(1) |
12,500 | |
| Allan R. Lyons(2) |
475,000 | |
| Gregg R. Honigblum(3) |
6,250 | |
| Karl Kipke(4) |
5,000,000 | |
| B. Sonny Bal, M.D.(5) |
12,500 | |
| Kevin Murphy |
600,000 |
| (1) | Includes 12,500 shares that were issued to Truetzel Revocable Trust, of which Mr. Truetzel and his spouse are the sole beneficiaries. |
| (2) | Shares were issued to Vestal. Mr. Lyons is the managing member and sole owner of 21st Century Strategic Investment Planning, LLC, the general partner of Vestal. |
| (3) | Represents 50% of the 12,500 shares that were issued to Creation Capital. Mr. Honigblum is a 50% owner and a managing member of Creation Capital. Mr. Honigblum resigned from our board of directors in September 2013. |
| (4) | Shares were issued to Hampshire Med Tech Partners, LP. Mr. Kipke is the managing member of Hampshire Med Tech, its general partner. |
| (5) | Shares were issued to Dr. Bal’s father. |
Warrant Restructuring and Private Placement of Common Stock
In March 2013, we amended the terms of certain of the common stock warrants issued in connection with the issuance of the Senior Secured Notes to further lower the exercise prices thereof from $25.77 per share to $17.53 per share. We then issued an aggregate of 178,516 shares of our common stock to 33 accredited investors upon exercise of the amended common stock warrants and the sale of additional shares of our common stock to other investors in the offering at $17.53 per share. We also issued to investors who exercised their common stock warrants new warrants to purchase an aggregate of 76,455 shares of our common stock at an exercise price of $17.53 per share. We issued an aggregate of 53,347 shares of our common stock and new warrants to purchase up to 17,773 shares of our common stock at an exercise price of $17.53 per share to the following directors, officers and beneficial owners of more than 5% of our common stock, on an as converted basis, and their affiliates:
| Name |
Common Stock
upon Exercise of Warrants |
New Common Stock | New Common Stock Warrants |
|||||||||
| Allan R. Lyons(1) |
9,214 | — | 9,214 | |||||||||
| Kevin Murphy |
8,558 | — | 8,558 | |||||||||
| Karl Kipke(2) |
— | 53,347 | — | |||||||||
| (1) | Represents the exercise of common stock warrants by, and issuance of common stock warrants to, Vestal. Mr. Lyons is the managing member and sole owner of 21st Century Strategic Investment Planning, LLC, the general partner of Vestal. |
| (2) | Represents 53,347 shares of common stock purchased by Hampshire Med Tech Partners, LP. Mr. Kipke is the managing member of Hampshire Med Tech, its general partner. |
114
Private Placement of Series F Convertible Preferred Stock
In August 2013 and September 2013, we issued an aggregate of 94.8 units, each unit consisting of 50,000 shares of our Series F convertible preferred stock and a warrant to acquire 970 shares of our common stock at an exercise price of $25.77 per share, to 45 accredited investors at $100,000 per unit. This resulted in our issuance of an aggregate of 4,740,000 shares of our Series F convertible preferred stock and warrants to purchase an aggregate of 91,951 shares of our common stock, including an aggregate of 1,125,000 shares of our Series F convertible preferred stock and warrants to purchase an aggregate of 21,824 shares of our common stock to the following directors, officers and beneficial owners of more than 5% of our common stock, on an as converted basis, and their affiliates:
| Name |
Number of Units | Purchase Price | Number of Shares of Series F Convertible Preferred Stock |
Common Stock Warrants |
||||||||||||
| Max E. Link, Ph.D. |
2.0 | $ | 200,000 | 100,000 | 1,940 | |||||||||||
| B. Sonny Bal, M.D. |
1.5 | $ | 150,000 | 75,000 | 1,455 | |||||||||||
| David W. Truetzel(1) |
1.0 | $ | 100,000 | 50,000 | 970 | |||||||||||
| Jay M. Moyes(2) |
0.5 | $ | 50,000 | 25,000 | 485 | |||||||||||
| George Singer(3) |
1.0 | $ | 100,000 | 50,000 | 970 | |||||||||||
| Allan R. Lyons(4) |
3.5 | $ | 350,000 | 175,000 | 3,395 | |||||||||||
| James G. Koman(5) |
1.0 | $ | 100,000 | 50,000 | 970 | |||||||||||
| Kevin Murphy(6) |
12.0 | $ | 1,200,000 | 600,000 | 11,639 | |||||||||||
| (1) | Investment made by Truetzel Revocable Trust, of which Mr. Truetzel and his spouse are the sole beneficiaries. |
| (2) | Investment made by Drayton Investments, LLC, of which Mr. Moyes is a managing member. |
| (3) | Consists of 50% of the investment made by Singer Bros. LLC. Mr. Singer is a 50% owner and a managing member of Singer Bros. LLC. Mr. Singer resigned from our board of directors in September 2013. |
| (4) | Investment made by Vestal. Mr. Lyons is the managing member and sole owner of 21st Century Strategic Investment Planning, LLC, the general partner Vestal. |
| (5) | Investment made by MSK, of which Mr. Koman is the managing member. |
| (6) | In connection with the sale and issuance of certain of the units in this financing, we also issued to TGP Securities, Inc., an entity controlled by Mr. Murphy, warrants to purchase 9,311 shares of our common stock at an exercise price of $56.70 per share and paid a cash commission of $480,000 to TGP Securities, Inc., neither of which are reflected in the table. |
Transactions with Creation Capital, LLC and Creation Capital Advisors, LLC
Mr. Gregg R. Honigblum, the Chief Executive Officer and a 50% co-owner of each of Creation Capital and Creation Capital Advisors, LLC, or Creation Advisors, served on our board of directors from 2006 until September 2013. We completed the offering of shares of our Series E convertible preferred stock between March 2010 and July 2010 through Creation Capital, which served as our placement agent. We paid Creation Capital approximately $1,135,000 and issued it a warrant to purchase 567,691 shares of Series E convertible preferred stock at an exercise price of $2.20 per share as commissions.
In connection with the private placement of our Senior Secured Notes between March 2011 and May 2011, Creation Capital served as our placement agent and received $1,049,000 and a warrant exercisable for 57,557 shares of common stock at an exercise price of $56.70 per share as commissions. In February 2012, when we issued an additional $5.0 million Senior Secured Note to Hampshire Med Tech Partners, LP, we paid Creation Capital an additional $212,500.
In June 2012, we entered into a financial advisor consulting agreement with Creation Advisors, pursuant to which we agreed to extend the termination date of the Series C convertible preferred stock warrants previously issued to Creation Capital from February 2013 to February 2018.
In connection with the conversion of our Senior Secured Notes in December 2012, we agreed to pay Creation Advisors a strategic financial advisory fee in the amount of approximately $447,000. We agreed to pay half of the advisory fee, approximately $223,000 in December 2012 and the remaining half within 24 months, which we paid in
115
September 2013. Karl Kipke, who beneficially owns more than 5% of our common stock, received $60,000 from Creation Advisors in 2012, as a consultant for Creation Advisors, for advising us at this time on our financing options.
In connection with the warrant restructuring and private placement of common stock in March 2013, we paid Creation Advisors a strategic financial advisory fee of approximately $250,000. In October 2013, we entered into a one-year consulting agreement for financial advisory services with Creation Advisors in which Creation Advisors will receive compensation of up to $180,000 in cash (payable $15,000 per month).
Registration Rights
The holders of 2,581,941 shares of common stock, assuming the conversion of our convertible preferred stock, holders of 72,939 shares of common stock, assuming the exercise of preferred stock warrants and further assuming the conversion of such shares of convertible preferred stock, and holders of 12,363 shares of common stock, assuming the exercise of common stock warrants, have entered into an agreement with us that provides certain registration rights to these holders and certain future transferees of their securities. See “Description of Capital Stock—Registration Rights” for a description of these rights. Such holders include the following directors, officers and beneficial owners of more than 5% of our common stock, on an as converted basis, and their affiliates:
| Name |
Common Stock |
Warrants | ||
| Allan R. Lyons(1) |
298,907 |
— | ||
| Kevin Murphy(2) |
258,803 |
— | ||
| Gregg R. Honigblum |
40,484 |
36,988(3) | ||
| Karl Kipke(4) |
42,829 |
— | ||
| B. Sonny Bal, M.D.(5) |
33,894 |
— | ||
| Max E. Link, Ph.D. |
26,614 |
— | ||
| George Singer(6) |
24,539 |
— | ||
| Rohit Patel(7) |
3,949 |
— | ||
| Jay M. Moyes |
1,534 |
— |
| (1) | Consists of 263,138 shares held by Vestal and 35,769 shares held by Lyonshare. Mr. Lyons is the managing member and sole owner of 21st Century Strategic Investment Planning, LLC, the general partner of each of Vestal and Lyonshare. |
| (2) | Includes 231,311 shares held by KM Healthcare Holdings, LP. No Footprints, LLC (“No Footprints”) is the general partner of KM Healthcare Holdings, LP. Mr. Murphy is a managing member of No Footprints. |
| (3) | Includes 50% of the 9,254 shares underlying a warrant to purchase shares of our common stock held by Creation Capital, of which Mr. Honigblum is a 50% owner. Mr. Honigblum is a managing member of Creation Capital. |
| (4) | Consists of 16,914 shares held by Hampshire Asset Management, LLC and 25,915 shares held by Hampshire Healthcare Partners, LP. Special Opportunities is the general partner of Hampshire Healthcare Partners, LP. Mr. Kipke is the managing member of Special Opportunities and the president of Hampshire Asset Management, LLC. |
| (5) | Consists of shares held jointly by Mr. Bal and his spouse. |
| (6) | Consists of 50% of the shares held by Singer Bros. LLC. Mr. Singer is a 50% owner and a managing member of Singer Bros. LLC. |
| (7) | Consists of shares held by the Patel Family Trust U/A/D November 7, 1996 of which Mr. Patel and his spouse are the sole beneficiaries. |
Equity Grants
We have granted options to purchase shares of our common stock and RSUs to our executive officers and directors. See “Executive and Director Compensation.”
Change in Control Agreements
We have entered into severance agreements with our executive officers as described in the section of this prospectus entitled “Executive and Director Compensation—Potential Payments Upon Termination or Change in Control.”
116
Indemnification Arrangements
Our restated certificate of incorporation and restated bylaws to be effective upon completion of this offering provide that we will indemnify our directors and officers to the fullest extent permitted by Delaware law. In addition, we expect to enter into indemnification agreements with each of our directors and executive officers prior to completion of the offering. A stockholder’s investment in our common stock may decline in value to the extent we pay the costs of settlement and damage awards against directors and officers pursuant to any indemnification provisions
Policy for Approval of Related Person Transactions
We believe that all the transactions described above were made on terms no less favorable to us than those that could have been obtained from unaffiliated third parties. With the exception of transactions in which related parties participated on the same terms as those of other participants who were not related parties, our board of directors reviewed and approved the transactions with each related party, namely our directors, executive officers and beneficial owners of more than 5% of our common stock, on an as converted basis, and affiliates of our directors, executive officers and 5% stockholders, and reviewed the material facts as to a related party’s relationship or interest in a transaction that were disclosed to our board of directors prior to our board of directors’ consideration of a transaction with a related party. The transactions involving related parties were approved by our board of directors, including all of our directors who were not interested in these transactions.
Following this offering, all future related party transactions will be approved by our audit committee. Pursuant to the written charter of our audit committee, the audit committee is responsible for reviewing and approving, prior to our entry into any transaction involving related parties, all transactions in which we are a participant and in which any parties related to us has or will have a direct or indirect material interest.
In reviewing and approving these transactions, the audit committee shall obtain, or shall direct our management to obtain on its behalf, all information that the committee believes to be relevant and important to a review of the transaction prior to its approval. Following receipt of the necessary information, a discussion shall be held of the relevant factors, if deemed to be necessary by the committee, prior to approval. If a discussion is not deemed to be necessary, approval may be given by written consent of the committee. No related party transaction shall be entered into prior to the completion of these procedures.
The audit committee or its chairman, as the case may be, shall approve only those related party transactions that are determined to be in, or not inconsistent with, the best interests of us and our stockholders, taking into account all available facts and circumstances as the committee or the chairman determines in good faith to be necessary. No member of the audit committee shall participate in any review, consideration or approval of any related party transaction with respect to which the member or any of his or her immediate family members is the related party.
117
The following table sets forth certain information regarding the beneficial ownership of our common stock as of January 15, 2014 by:
| • | each of our current directors; |
| • | the executive officers named in the summary compensation table; |
| • | all of our directors and executive officers as a group; and |
| • | each stockholder known by us to own beneficially more than 5% of our common stock. |
Beneficial ownership is determined in accordance with the rules of the SEC and includes voting or investment power with respect to the securities. Shares of common stock that may be acquired by an individual or group within 60 days of January 15, 2014, pursuant to the exercise of options or warrants, are deemed to be outstanding for the purpose of computing the percentage ownership of such individual or group, but are not deemed to be outstanding for the purpose of computing the percentage ownership of any other person shown in the table. The percentage ownership information under the column entitled “Before Offering” is based on 8,627,454 shares of common stock outstanding on January 15, 2014, which assumes the conversion of all outstanding shares of preferred stock into 8,029,779 shares of common stock. The percentage ownership information under the column entitled “After Offering” is based on the sale of 3,500,000 shares of common stock in this offering.
Except as indicated in footnotes to this table, we believe that the stockholders named in this table have sole voting and investment power with respect to all shares of common stock shown to be beneficially owned by them, based on information provided to us by such stockholders. The address for each director and executive officer listed is: c/o Amedica Corporation, 1885 West 2100 South, Salt Lake City, Utah 84119.
| Name and Address of Beneficial Owner |
Number of Shares Beneficially Owned |
Percentage of Shares Beneficially Owned |
||||||||||
| Before Offering |
After Offering |
|||||||||||
| Directors and Named Executive Officers: |
||||||||||||
| Max E. Link, Ph.D.(1) |
76,291 | * | % | * | % | |||||||
| B. Sonny Bal, M.D.(2) |
57,298 | * | * | |||||||||
| David W. Truetzel(3) |
28,239 | * | * | |||||||||
| Jeffrey S. White |
— | * | * | |||||||||
| Jay M. Moyes(4) |
8,268 | * | * | |||||||||
| Eric K. Olson(5) |
— | * | * | |||||||||
| Bryan J. McEntire(6) |
7,759 | * | * | |||||||||
| All directors and executive officers as a group (12 individuals)(7) |
177,855 | 2.0 | 1.5 | |||||||||
| Five Percent Stockholders: |
||||||||||||
| Karl Kipke(8) |
1,575,012 | 15.5 | 11.5 | |||||||||
| Hampshire Group, LLC |
||||||||||||
| 500 Plaza on the Lake, Suite #103 |
||||||||||||
| Austin, TX 78746 |
||||||||||||
| Allan R. Lyons(9) |
509,038 | 5.9 | 4.2 | |||||||||
| 92 Hawley Street, P. O. Box 1330 |
||||||||||||
| Binghamton, NY 13902 |
||||||||||||
| Kevin Murphy(10) |
505,897 | 5.8 | 4.2 | |||||||||
| TGP Securities, Inc. |
||||||||||||
| 75 Varick St., Suite 1510 |
||||||||||||
| New York, NY 10013 |
||||||||||||
| * | Represents beneficial ownership of less than 1% of the shares of our common stock. |
| (1) | Consists of 70,085 shares of our common stock, options to acquire 3,782 shares of our common stock currently exercisable or exercisable within 60 days of January 15, 2014. Also includes 2,424 common stock warrants that are currently exercisable. Does not include 581 RSUs. |
118
| (2) | Consists of 18,750 shares of our common stock held by Dr. Bal, 33,894 shares of our common stock held by Dr. Bal and his spouse, options to acquire 3,200 shares of our common stock currently exercisable or exercisable within 60 days of January 15, 2014. Also includes 1,454 common stock warrants that are currently exercisable. Does not include 581 RSUs. |
| (3) | Consists of 337 shares of our common stock held by Mr. Truetzel, 50% of 22,129 shares of our common stock held by Spinal Management, LLC, of which Mr. Truetzel is a 50% member, 15,625 shares of our common stock held by Truetzel Revocable Trust of which Mr. Truetzel and his spouse are the sole beneficiaries. Also includes 1,212 common stock warrants that are currently exercisable. Does not include 3,297 RSUs. |
| (4) | Consists of 1,534 shares of our common stock, 6,250 shares of our common stock that are beneficially owned by Drayton Investments, LLC, and 484 common stock warrants that are immediately exercisable and beneficially owned by Drayton Investments, LLC. Mr. Moyes is a managing member of Drayton Investments, LLC. Does not include 58,778 RSUs. |
| (5) | Does not include 25,218 RSUs. |
| (6) | Consists of options to acquire 7,759 shares of our common stock currently exercisable or exercisable within 60 days of January 15, 2014, and does not include 17,071 RSUs. |
| (7) | Consists of 171,592 shares of our common stock, options to acquire 14,741 shares of our common stock, and 5,574 common stock warrants that are currently exercisable. Does not include 105,526 RSUs. |
| (8) | Consists of: (i) 16,179 warrants that are currently exercisable held by Mr. Kipke; (ii) 1,303,356 shares and 96,994 common stock warrants that are currently exercisable held by Hampshire Med Tech Partners, LP; (iii) 25,908 shares held by Hampshire Healthcare Partners, LP; and (iv) 16,919 shares held by Hampshire Asset Management, LLC. Hampshire Med Tech is the general partner of Hampshire Med Tech Partners, LP and Special Opportunities is the general partner of Hampshire Healthcare Partners, LP. Mr. Kipke is the managing member of each of Hampshire Med Tech and Special Opportunities and the president of Hampshire Asset Management, LLC. Also includes 115,655 shares held by KM Healthcare Holdings, LP. No Footprints is the general partner of KM Healthcare Holdings, LP. Mr. Kipke is a managing member of No Footprints and shares voting and dispositive power with Mr. Murphy with respect to the shares held by KM Healthcare Holdings, LP. |
| (9) | Consists of: (i) 447,224 shares and 17,789 warrants that are currently exercisable held by Vestal; and (ii) 40,714 shares held by Lyonshare. 21st Century Strategic Investment Planning, LLC is the general partner of each of Vestal and Lyonshare. Mr. Lyons is the managing member of 21st Century Strategic Investment Planning, LLC and, accordingly, has voting and dispositive power with respect to the shares held by Vestal and Lyonshare. Also includes 800 shares of common stock and 2,511 shares of common stock issuable upon exercise of warrants held by Mr. Lyons. |
| (10) | Consists of: (i) 115,656 shares held by KM Healthcare Holdings, LP; (ii) 26,939 shares and 1,939 common stock warrants that are currently exercisable held in an individual retirement account for Mr. Murphy’s benefit; and (iii) 309,112 shares and 42,941 warrants that are currently exercisable held directly by Mr. Murphy. No Footprints is the general partner of KM Healthcare Holdings, LP. Mr. Murphy is a managing member of No Footprints and shares voting and dispositive power with Mr. Kipke with respect to the shares held by KM Healthcare Holdings, LP. Also includes warrants to purchase 9,311 shares of our common stock warrants that are currently exercisable and that are held by TGP Securities, Inc., an entity controlled by Mr. Murphy. |
119
We are authorized to issue 250,000,000 shares of common stock, $0.01 par value per share, and 130,000,000 shares of preferred stock, $0.01 par value per share. Upon completion of this offering, there will be 12,127,454 shares of common stock and no shares of preferred stock outstanding. Assuming the conversion of our preferred stock as of September 30, 2013, we had 8,627,454 shares of common stock outstanding held of record by 584 separate stockholders, there were outstanding options to purchase 106,409 shares of common stock, 188,128 shares of common stock issuable upon the vesting of outstanding RSUs issued under the 2012 Stock Plan and outstanding warrants to acquire 633,669 shares of common stock, assuming the conversion of our preferred stock warrants into common stock warrants. The following description summarizes the most important terms of our capital stock. Because it is only a summary, it does not contain all the information that may be important to you. For a complete description you should refer to our restated certificate of incorporation and restated bylaws, to be effective upon completion of this offering, copies of which have been filed as exhibits to the registration statement, and to the applicable provisions of the Delaware General Corporation Law.
Common Stock
As of September 30, 2013, we had outstanding an aggregate of 597,675 shares of common stock held of record by 92 stockholders. Holders of our common stock are entitled to one vote for each share held of record on all matters submitted to a vote of the stockholders, and do not have cumulative voting rights. Accordingly, the holders of a majority of the shares of our common stock entitled to vote can elect all of the directors standing for election. Subject to preferences that may be applicable to any outstanding shares of preferred stock, holders of our common stock are entitled to receive ratably such dividends, if any, as may be declared from time to time by our board of directors out of funds legally available for dividend payments. All outstanding shares of our common stock are fully paid and nonassessable, and the shares of our common stock to be issued upon completion of this offering will be fully paid and nonassessable. The holders of common stock have no preferences or rights of conversion, exchange, pre-emption or other subscription rights. There are no redemption or sinking fund provisions applicable to our common stock. In the event of any liquidation, dissolution or winding-up of our affairs, holders of our common stock will be entitled to share ratably in our assets that are remaining after payment or provision for payment of all of our debts and obligations and after liquidation payments to holders of outstanding shares of preferred stock, if any.
Preferred Stock
As of September 30, 2013, we had outstanding an aggregate of 80,910,394 shares of preferred stock held of record by 523 stockholders. Upon the closing of this offering, all outstanding shares of our preferred stock will have been converted into shares of our common stock. Following this offering, our restated certificate of incorporation will be restated to delete all reference to such shares of preferred stock. The preferred stock, if issued, would have priority over our common stock with respect to dividends and other distributions, including the distribution of assets upon liquidation. Our board of directors has the authority, without further stockholder authorization, to issue from time to time shares of preferred stock in one or more series and to fix the terms, limitations, relative rights and preferences and variations of each series. Although we have no present plans to issue any shares of preferred stock, the issuance of shares of preferred stock, or the issuance of rights to purchase such shares, could decrease the amount of earnings and assets available for distribution to the holders of common stock, could adversely affect the rights and powers, including voting rights, of the common stock, and could have the effect of delaying, deterring or preventing a change in control of us or an unsolicited acquisition proposal.
Warrants
As of September 30, 2013 we had the following warrants outstanding to purchase a total of 2,344,731 shares of our preferred stock and a total of 473,835 shares of our common stock:
| • | warrants purchase in the aggregate 1,203,750 shares of Series C convertible preferred stock which, upon completion of this offering, will be converted to a warrant to purchase in the aggregate 52,325 shares of our common stock at an exercise price of $56.70 per share, terminating in February 2018; |
120
| • | warrants to purchase in the aggregate 253,290 shares of Series D convertible preferred stock which, upon completion of this offering, will be converted to a warrant to purchase in the aggregate 12,786 shares of common stock at an exercise price of $85.06 per share, terminating in April 2014; |
| • | warrants to purchase in the aggregate 567,691 shares of Series E convertible preferred stock which, upon completion of this offering, will be converted to a warrant to purchase in the aggregate 25,020 shares of our common stock at an exercise price of $56.70 per share, terminating in September 2015; |
| • | a warrant to purchase 50,000 shares of Series E convertible preferred stock which, upon completion of this offering, will be converted to a warrant to purchase 2,204 shares of our common stock at an exercise price of $56.70 per share, terminating in April 2015; |
| • | warrants to purchase in the aggregate 270,000 shares of Series F convertible preferred stock which, upon completion of this offering, will be converted to a warrant to purchase in the aggregate 67,499 shares of common stock at an exercise price of $51.55 per share, terminating in December 2022; |
| • | warrants to purchase in the aggregate 22,064 shares of common stock at an exercise price of $85.06 per share, issued in June and August 2008, and terminating seven years from the date of issuance; |
| • | a warrant to purchase 2,910 shares of common stock at an exercise price of $45.11 per share, issued in February 2010 and terminating on February 17, 2017; |
| • | warrants to purchase in the aggregate 288,685 shares of common stock at an exercise price of $17.53 per share, originally issued between March and May 2011, and terminating seven years from the date of issuance; |
| • | warrants to purchase in the aggregate 388 shares of common stock at an exercise price of $51.55 per share, issued on April 18, 2011 and November 15, 2011, and terminating three years from date of issuance; |
| • | warrants to purchase in the aggregate 57,557 shares of common stock at an exercise price of $56.70 per share, issued on May 9, 2011, and terminating five years from the date of issuance; |
| • | a warrant to purchase 970 shares of common stock at an exercise price of $51.55 issued on March 17, 2011; |
| • | warrants to purchase in the aggregate 91,951 shares of common stock at an exercise price of $25.77 per share, issued in August and September 2013, and terminating five years from the date of issuance, which have a price protection provision for any securities issued by us at a price below $25.77 per share (excluding shares sold in connection with this offering and shares granted to our employees or consultants); and |
| • | warrants to purchase 9,311 shares of common stock at an exercise price of $56.70 per share, issued in August and September 2013, and terminating five years from the date of issuance. |
These warrants provide for adjustments of the exercise price and the number of shares underlying the warrants upon the occurrence of certain events, including stock dividends, stock splits, reclassifications or other changes in our corporate structure. The holders of these warrants have registration rights that are outlined below under the heading “—Registration Rights.”
Registration Rights
Holders of 2,581,941 shares of our Series A and A-1, Series B and B-1, Series C and C-1 (other than those who received shares of Series C convertible preferred stock as a result of the settlement in 2012), Series D and D-1 and Series E convertible preferred stock (other than those who received shares of Series E convertible preferred stock as a result of the 2010 merger with US Spine and the related settlement in 2012) and holders of 85,302 of our Series C, D and E warrants and common stock warrants have entered into an agreement with us that provides certain registration rights to such holders and certain future transferees of their securities. These registration rights are subject to certain conditions and limitations, including our right, based on advice of the lead managing underwriter of a future offering, to limit the number of shares included in any such registration under certain circumstances. We are generally required to pay all expenses incurred in connection with registrations effected in connection with the registration rights below, excluding underwriting discounts and commissions. The registration rights described below with respect to these
121
securities terminate upon the earlier to occur of (i) the effectiveness of a registration statement with respect to the sale of such securities under the Securities Act and the disposal of such securities in accordance with the registration statement; (ii) the owner of such securities is able to sell all of such securities in a three-month period pursuant to Rule 144 under the Securities Act; (iii) such securities shall become eligible for sale pursuant to Rule 144 under the Securities Act; or (iv) such securities shall have been otherwise transferred pursuant to the Securities Act or an available exemption and new certificates not bearing a legend restricting further transfer shall have been delivered by us, and subsequent disposition of such securities shall not require the registration or qualification of such securities under the Securities Act or any similar state law then in effect. The registration rights may be transferred to any purchaser or recipient of at least 50% of the shares purchased by such stockholders and holders of warrants to the extent they were original purchasers in the preferred stock offerings.
Demand Rights. At any time after 180 days following the completion of our initial public offering, subject to specified limitations, holders of not less than a majority of then existing registrable securities may require that we use commercially reasonable efforts to effect the registration on Form S-1 or Form S-3 (or any other form we are qualified to use) of securities owned by such holders having an aggregate anticipated price to the public of at least $10,000,000 (before selling expenses), or at least $5,000,000 (before selling expenses) in the case of a Form S-3 registration, for sale under the Securities Act. We may be required to effect up to four such registrations in total. We may be required to effect up to two such registrations during the one-year period following the date holders initially notify us of their request that we effect such a registration. Holders of registrable securities who are not among the holders who initially request that we effect a registration are entitled to notice and are entitled to include their shares of common stock in the registration.
Shelf Registration Rights. At any time after we become eligible to file a registration statement on Form S-3, holders of not less than a majority of registrable securities may request, in writing, that we effect the registration on Form S-3, or any successor or similar short form, of securities having an aggregate anticipated offering price to the public of at least $10,000,000 (before selling expenses). We may be required to effect up to two such registrations during the one-year period following the date holders initially notify us of their request that we effect such a registration. Holders with these registration rights who are not among the holders who initially requested that we effect a registration are entitled to notice and are entitled to include their shares of common stock in the registration.
Piggyback Rights. If, at any time commencing 180 days following the completion of our initial public offering, we propose to register shares of our common stock under the Securities Act in connection with a public offering of common stock solely for cash, we will, prior to such filing, give written notice to all holders having registration rights of our intention to do so. Upon the written request of any holder or holders of registrable securities given to us in a timely manner, we shall cause all securities which we have been requested by such holder or holders to register to be registered under the Securities Act to the extent necessary to permit their sale or other disposition in accordance with the intended methods of distribution specified in the request of the holder or holders. We shall have the right to withdraw any such registration without obligation to any stockholder, except for our obligation to pay all registration expenses related to such withdrawn registration. In addition, under certain circumstances, the underwriters, if any, may limit the number of shares included in any such registration. These piggyback registration rights do not apply to registrations of our securities that we initiate that are (i) incidental to any of our stock option plans or other employee benefit plans or a dividend reinvestment plan, (ii) incidental to a business combination or any other similar transaction, the purpose of which is not to raise capital, or (iii) pursuant to a so-called “unallocated” or “universal” shelf registration statement.
Effects of Anti-Takeover Provisions of Our Restated Certificate of Incorporation, Our Restated Bylaws and Delaware Law
The provisions of (1) Delaware law, (2) our restated certificate of incorporation to be effective upon completion of this offering and (3) our restated bylaws to be effective upon completion of this offering discussed below could discourage or make it more difficult to prevail in a proxy contest or effect other change in our management or the acquisition of control by a holder of a substantial amount of our voting stock. It is possible that these provisions could make it more difficult to accomplish, or could deter, transactions that stockholders
122
may otherwise consider to be in their best interests or our best interests. These provisions are intended to enhance the likelihood of continuity and stability in the composition of our board of directors and in the policies formulated by the board of directors and to discourage certain types of transactions that may involve an actual or threatened change in control of our company. These provisions are designed to reduce our vulnerability to an unsolicited acquisition proposal. These provisions also are intended to discourage certain tactics that may be used in proxy fights. These provisions also may have the effect of preventing changes in our management.
Delaware Statutory Business Combinations Provision. We are subject to the anti-takeover provisions of Section 203 of the Delaware General Corporation Law. In general, Section 203 prohibits a publicly-held Delaware corporation from engaging in a “business combination” with an “interested stockholder” for a period of three years after the date of the transaction in which the person became an interested stockholder, unless the business combination is, or the transaction in which the person became an interested stockholder was, approved in a prescribed manner or another prescribed exception applies. For purposes of Section 203, a “business combination” is defined broadly to include a merger, asset sale or other transaction resulting in a financial benefit to the interested stockholder, and, subject to certain exceptions, an “interested stockholder” is a person who, together with his or her affiliates and associates, owns (or within three years prior, did own) 15% or more of the corporation’s voting stock.
Classified Board of Directors; Appointment of Directors to Fill Vacancies; Removal of Directors for Cause. Our restated certificate of incorporation provides that our board of directors will be divided into three classes as nearly equal in number as possible. Each year the stockholders will elect the members of one of the three classes to a three-year term of office. All directors elected to our classified board of directors will serve until the election and qualification of their respective successors or their earlier resignation or removal. The board of directors is authorized to create new directorships and to fill any positions so created and is permitted to specify the class to which any new position is assigned. The person filling any of these positions would serve for the term applicable to that class. The board of directors (or its remaining members, even if less than a quorum) is also empowered to fill vacancies on the board of directors occurring for any reason for the remainder of the term of the class of directors in which the vacancy occurred. Members of the board of directors may only be removed for cause and only by the affirmative vote of holders of at least 75% of our outstanding voting stock. These provisions are likely to increase the time required for stockholders to change the composition of the board of directors. For example, in general, at least two annual meetings will be necessary for stockholders to effect a change in a majority of the members of the board of directors.
Authorization of Blank Check Preferred Stock. Our restated certificate of incorporation provides that, upon completion of this offering, our board of directors will be authorized to issue, without stockholder approval, blank check preferred stock. Blank check preferred stock can operate as a defensive measure known as a “poison pill” by diluting the stock ownership of a potential hostile acquirer to prevent an acquisition that is not approved by our board of directors.
Advance Notice Provisions for Stockholder Proposals and Stockholder Nominations of Directors. Our restated bylaws provide that, for nominations to the board of directors or for other business to be properly brought by a stockholder before a meeting of stockholders, the stockholder must first have given timely notice of the proposal in writing to our Secretary. For an annual meeting, a stockholder’s notice generally must be delivered not less than 45 days nor more than 75 days prior to the anniversary of the mailing date of the proxy statement for the previous year’s annual meeting. For a special meeting, the notice must generally be delivered no less than 60 days nor more than 90 days prior to the special meeting or ten days following the day on which public announcement of the meeting is first made. Detailed requirements as to the form of the notice and information required in the notice are specified in our restated bylaws. If it is determined that business was not properly brought before a meeting in accordance with our bylaw provisions, this business will not be conducted at the meeting.
Special Meetings of Stockholders. Special meetings of the stockholders may be called only by our board of directors pursuant to a resolution adopted by a majority of the total number of directors.
123
No Stockholder Action by Written Consent. Our restated certificate of incorporation does not permit our stockholders to act by written consent. As a result, any action to be effected by our stockholders must be effected at a duly called annual or special meeting of the stockholders.
Super-Majority Stockholder Vote required for Certain Actions. The Delaware General Corporation Law provides generally that the affirmative vote of a majority of the shares entitled to vote on any matter is required to amend a corporation’s certificate of incorporation or bylaws, unless the corporation’s certificate of incorporation or bylaws, as the case may be, requires a greater percentage. Our restated certificate of incorporation requires the affirmative vote of the holders of at least 75% of our outstanding voting stock to amend or repeal any of the provisions discussed in this section of this prospectus entitled “Effect of Anti-Takeover Provisions of Our Restated Certificate of Incorporation, Our Restated Bylaws and Delaware Law” or to reduce the number of authorized shares of common stock or preferred stock. This 75% stockholder vote would be in addition to any separate class vote that might in the future be required pursuant to the terms of any preferred stock that might then be outstanding. A 75% vote is also required for any amendment to, or repeal of, our restated bylaws by the stockholders. Our restated bylaws may be amended or repealed by a simple majority vote of the board of directors.
Transfer Agent and Registrar
The transfer agent and registrar for our common stock is American Stock Transfer and Trust Company. The transfer agent and the registrar’s address is 59 Maiden Lane, New York, New York 10038.
Listing
At the present time, there is no established trading market for our common stock. Our common stock has been approved for listing on The NASDAQ Capital Market under the symbol “AMDA.”
124
SHARES ELIGIBLE FOR FUTURE SALE
Prior to this offering, there has been no public market for our common stock. Future sales of substantial amounts of our common stock in the public market, including shares issued upon the vesting of RSUs and the exercise of outstanding options and warrants, or the anticipation of such sales, could adversely affect prevailing market prices prevailing from time to time. Furthermore, because only a limited number of shares will be available for sale shortly after this offering due to existing contractual and legal restrictions on resale as described below, there may be sales of substantial amounts of our common stock in the public market after the restrictions lapse. This may adversely affect the prevailing market price and our ability to raise equity capital in the future.
Upon completion of this offering, we will have 12,127,454 shares of common stock outstanding, assuming the conversion of all outstanding shares of convertible preferred stock, no exercise of the underwriters’ option to purchase additional shares and no exercise of any options and warrants outstanding as of September 30, 2013. Of these shares, all of the shares sold in this offering will be freely transferable without restriction or registration under the Securities Act, except for any shares purchased by one of our existing “affiliates,” as that term is defined in Rule 144 under the Securities Act. The remaining 8,627,454 shares of common stock (as well as 188,128 shares underlying outstanding RSUs and 106,409 shares subject to outstanding stock options and 633,669 warrants upon issuance) will be “restricted shares” as defined in Rule 144. Restricted shares may be sold in the public market only if registered or if they qualify for an exemption from registration under Rules 144 or 701 of the Securities Act, as described below. Substantially all of these restricted shares will be subject to the 180-day lock-up period. Please see the section below entitled “—Lock-up Agreements” for further information. Immediately after the 180-day lock-up period, 7,008,077 shares will be freely tradable under Rule 144 or Rule 701(g)(3) under the Securities Act and 1,619,377 shares will be eligible for resale under Rule 144 or Rule 701(g)(3), subject to volume limitations. 8,751,175 shares will be freely tradable or eligible for resale at various times after the 180-day lock-up period under Rule 144 or Rule 701(g)(3), some of which are subject to volume limitations. In addition, upon completion of this offering, a holder of warrants to acquire shares of our common stock will be able to net exercise such shares by surrendering a portion of that holder’s warrants as payment of the exercise price rather than paying the exercise price in cash.
Rule 144
In general, under Rule 144 as currently in effect, beginning 90 days after the effective date of the registration statement of which this prospectus is a part, a person, or persons whose shares are aggregated, who owns shares that were purchased from us, or any affiliate, at least six months previously, is entitled to sell within any three-month period a number of shares that does not exceed the greater of:
| • | 1% of our then-outstanding shares of common stock, which will equal approximately 121,300 shares immediately after this offering; or |
| • | the average weekly trading volume of our common stock on The NASDAQ Capital Market during the four calendar weeks preceding the filing of a notice of the sale on Form 144. |
Sales under Rule 144 are also subject to manner of sale provisions, notice requirements and the availability of current public information about us. Rule 144 also provides that affiliates that sell our common stock that are not restricted securities must still comply with certain other restrictions of that rule on their manner of sale of our shares, other than the holding period requirement. Additionally, under Rule 144 as currently in effect, a person who is not deemed to have been one of our affiliates at any time during the 90 days preceding a sale, and who owns shares within the definition of “restricted securities” under Rule 144 that were purchased from us, or any affiliate, at least one year previously, would be entitled to sell shares under Rule 144 without regard to the volume limitations, manner of sale provisions, public information requirements or notice requirements described above.
We are unable to estimate the number of shares that will be sold under Rule 144 since this will depend on the market price for our common stock, the personal circumstances of the stockholder and other factors.
125
Rule 701
In general, under Rule 701 as currently in effect, any of our employees, directors, officers, consultants or advisors who purchased shares from us in connection with a qualified compensatory stock or option plan or other written agreement before the effective date of this offering is eligible to resell such shares 90 days after the effective date of this offering in reliance on Rule 144. Securities issued in reliance on Rule 701 are restricted securities and, subject to the contractual restrictions described above, beginning 90 days after the date of this prospectus, may be sold by persons other than “affiliates,” as defined in Rule 144, subject only to the manner of sale provisions of Rule 144 and by “affiliates” under Rule 144 without compliance with its one year minimum holding requirement.
Registration Rights
The holders of 2,581,941 shares of common stock, assuming the conversion of our convertible preferred stock, holders of 72,939 shares of common stock, assuming the exercise of preferred stock warrants and further assuming the conversion of such shares of convertible preferred stock, and holders of 12,363 shares of common stock, assuming the exercise of common stock warrants, have entered into an agreement with us that provides certain registration rights to these holders and certain future transferees of their securities. Registration of these shares under the Securities Act would result in these shares becoming freely tradable without restriction under the Securities Act immediately upon the effectiveness of the registration, except for shares held by affiliates, subject to the lock-up agreements described under “—Lock-up Agreements.” See “Description of Capital Stock—Registration Rights.”
Warrants
As of September 30, 2013, we had the following outstanding warrants to purchase a total of 2,344,731 shares of our preferred stock and a total of 473,835 shares of our common stock:
| • | warrants to purchase in the aggregate 1,203,750 shares of Series C convertible preferred stock which, upon completion of this offering, will be converted to a warrant to purchase in the aggregate 52,325 shares of our common stock at an exercise price of $56.70 per share, terminating in February 2018; |
| • | warrants to purchase in the aggregate 253,290 shares of Series D convertible preferred stock which, upon completion of this offering, will be converted to a warrant to purchase in the aggregate 12,786 shares of common stock at an exercise price of $85.06 per share, terminating in April 2014; |
| • | warrants to purchase in the aggregate 567,691 shares of Series E convertible preferred stock, which upon completion of this offering, will be converted to a warrant to purchase in the aggregate 25,020 shares of common stock at an exercise price of $56.70 per share, terminating between March and September 2015; |
| • | a warrant to purchase 50,000 shares of Series E convertible preferred stock which, upon completion of this offering, will be converted to a warrant to purchase 2,204 shares of our common stock at an exercise price of $56.70 per share, terminating in April 2015; |
| • | warrants to purchase in the aggregate 270,000 shares of Series F convertible preferred stock which, upon completion of this offering, will be converted to a warrant to purchase in the aggregate 67,499 shares of common stock at an exercise price of $51.55 per share, terminating in December 2022; |
| • | warrants to purchase in the aggregate 22,064 shares of common stock at an exercise price of $85.06 per share, issued in June and August 2008, and terminating seven years from the date of issuance; |
| • | a warrant to purchase 2,910 shares of common stock at an exercise price of $45.11 per share, issued in February 2010 and terminating on February 17, 2017; |
| • | warrants to purchase in the aggregate 288,685 shares of common stock at an exercise price of $17.53 per share, originally issued between March and May 2011, and terminating seven years from the date of issuance; |
| • | warrants to purchase in the aggregate 388 shares of common stock at an exercise of $51.55 per share, issued on April 18, 2011 and November 15, 2011, and terminating three years from the date of issuance; |
| • | warrants to purchase in the aggregate 57,557 shares of common stock at an exercise price of $56.70 per share, issued on May 9, 2011, and terminating five years from the date of issuance; |
| • | a warrant to purchase 970 shares of common stock at an exercise price of $51.55, issued on March 17, 2011; |
126
| • | warrants to purchase in the aggregate 91,951 shares of common stock at an exercise price of $25.77 per share, issued in August and September 2013, and terminating five years from the date of issuance which have a price protection provision for any securities issued by us at a price below $25.77 per share (excluding shares sold in connection with this offering and shares granted to our employees or consultants); and |
| • | warrants to purchase 9,311 shares of common stock at an exercise price of $56.70 per share, issued in August and September 2013, and terminating five years from the date of issuance. |
8,093,379 shares of common stock and 620,959 shares of common stock issuable pursuant to these warrants are subject to the lock-up agreements described under “—Lock-up Agreements.”
Stock Options and Restricted Stock Units
As of September 30, 2013, options to purchase a total of 93,220 shares of common stock were outstanding and options to purchase 92,820 shares of common stock were exercisable. All of the shares subject to options were issued pursuant to the 2003 Plan and substantially all are subject to lock-up agreements. As of September 30, 2013, there were a total of 123,660 shares of common stock issuable upon the vesting of outstanding RSUs issued under the 2012 Plan and 168,553 shares of common stock were available for future equity grants under the 2012 Plan.
Upon completion of this offering, we intend to file a registration statement on Form S-8 under the Securities Act covering all shares of common stock subject to outstanding options or issuable pursuant to the 2003 Plan and the 2012 Plan. Subject to Rule 144 volume limitations applicable to affiliates, shares registered under any registration statements will be available for sale in the open market, except to the extent that the shares are subject to vesting restrictions with us or the contractual restrictions described below.
All RSUs issued prior to the completion of this offering will be eligible to be sold under Rule 701 or Rule 144.
Lock-up Agreements
We, all of our officers, directors and substantially all of our stockholders have agreed, subject to limited exceptions, not to offer, pledge, sell, contract to sell, hypothecate, establish an open “put equivalent position” within the meaning of Rule 16a-1(h) of the Exchange Act, grant any option or purchase any option or contract to sell, sell any option or contract to purchase, lend or otherwise encumber, dispose of or transfer, or grant any rights with respect to directly or indirectly any shares of our common stock or any securities convertible into or exercisable or exchangeable for shares of our common stock, or enter into any transaction which would have the same effect, or enter into any swap, hedge or other arrangement that transfers to another, in whole or in part, any of the economic consequences of ownership of any shares of common stock or any securities convertible into or exercisable or exchangeable for shares of common stock held prior to the offering during the period beginning on the date of this prospectus and ending 180 days thereafter, whether any such transaction is to be settled by delivery of shares of our common stock or such other securities, cash or otherwise, or publicly disclose the intention to may any such offer, sale, pledge or disposition of shares of our common stock without the prior written consent of JMP Securities LLC. In addition, such persons have agreed that without the prior written consent of JMP Securities LLC, such persons will not make any demand for or exercise any right with respect to the registration of any shares of our common stock or for any security convertible into or exercisable or exchangeable for common stock.
JMP Securities LLC may in its sole discretion choose to release any or all of these shares from these restrictions prior to the expiration of the 180-day period. The lock-up restrictions will not apply to transactions relating to common stock acquired in open market transactions after the closing of this offering provided that no filing under Section 13 or Section 16(a) of the Exchange Act is required or will be voluntarily made in connection with subsequent sales of common stock or other securities acquired in such market transactions. The lock-up restrictions also will not apply to certain transfers not involving a disposition for value, provided that the recipient agrees to be bound by these lock-up restrictions and provided that such transfers are not required to be reported in any public report or filing with the SEC, or otherwise, during the lock-up period.
127
MATERIAL U.S. FEDERAL TAX CONSEQUENCES
FOR NON-U.S. HOLDERS OF COMMON STOCK
The following is a general discussion of material U.S. federal income and estate tax considerations relating to the purchase, ownership and disposition of shares of our common stock by a non-U.S. holder. For purposes of this discussion, the term “non-U.S. holder” means a beneficial owner of shares of our common stock that is, for U.S. federal income tax purposes, an individual, corporation, estate or trust other than:
| • | an individual who is a citizen or resident of the United States; |
| • | a corporation, or other organization treated as a corporation for U.S. federal income tax purposes, created or organized in or under the laws of the United States or of any political subdivision of the United States; |
| • | an estate the income of which is subject to U.S. federal income taxation regardless of its source; or |
| • | a trust, if (1) a U.S. court is able to exercise primary supervision over the administration of the trust and one or more U.S. persons have authority to control all substantial decisions of the trust or (2) if the trust has a valid election to be treated as a U.S. person under applicable U.S. Treasury Regulations. |
A modified definition of non-U.S. holder applies for U.S. federal estate tax purposes (as discussed below).
This discussion is based on current provisions of the Internal Revenue Code, existing and proposed U.S. Treasury Regulations promulgated or proposed thereunder and current administrative and judicial interpretations thereof, all as in effect as of the date of this prospectus and all of which are subject to change or to differing interpretation, possibly with retroactive effect. Any change could alter the tax consequences to non-U.S. holders described in this prospectus. In addition, the Internal Revenue Service, or the IRS, could challenge one or more of the tax consequences described in this prospectus.
We assume in this discussion that each non-U.S. holder holds shares of our common stock as a capital asset (generally, property held for investment). This discussion does not address all aspects of U.S. federal income and estate taxation that may be relevant to a particular non-U.S. holder in light of that non-U.S. holder’s individual circumstances nor does it address any aspects of state, local or non-U.S. taxes, or, except as explicitly addressed herein, U.S. federal taxes other than income and estate taxes. This discussion also does not consider any specific facts or circumstances that may apply to a non-U.S. holder and does not address the special tax considerations that may be applicable to particular non-U.S. holders, such as:
| • | insurance companies; |
| • | tax-exempt organizations; |
| • | financial institutions; |
| • | brokers or dealers in securities; |
| • | regulated investment companies; |
| • | pension plans; |
| • | controlled foreign corporations; |
| • | passive foreign investment companies; |
| • | corporations that accumulate earnings to avoid U.S. federal income tax; |
| • | certain U.S. expatriates; |
| • | persons subject to the alternative minimum tax; |
| • | persons in special situations; |
| • | persons that have a “functional currency” other than the U.S. dollar; |
| • | persons that acquire our common stock as compensation for services; and |
| • | owners that hold our common stock as part of a straddle, hedge, conversion transaction, synthetic security or other integrated investment. |
In addition, this discussion does not address the tax treatment of partnerships or persons who hold their common stock through partnerships or other entities that are transparent for U.S. federal income tax purposes. A partner in a partnership or other transparent entity that will hold our common stock should consult his, her or its own tax advisor regarding the tax consequences of the ownership and disposition of shares of our common stock through a partnership or other transparent entity, as applicable.
128
Prospective investors should consult their own tax advisors regarding the U.S. federal, state, local and non-U.S. income and other tax considerations of acquiring, holding and disposing of shares of our common stock.
Dividends
If we pay distributions of cash or property with respect to shares of our common stock, those distributions generally will constitute dividends for U.S. federal income tax purposes to the extent paid from our current or accumulated earnings and profits, as determined under U.S. federal income tax principles and will be subject to withholding as described in the paragraphs below. If a distribution exceeds our current and accumulated earnings and profits, the excess will be treated as a tax-free return of the non-U.S. holder’s investment, up to such holder’s tax basis in its shares of our common stock. Any remaining excess will be treated as capital gain, subject to the tax treatment described below under the heading “—Gain on Sale, Exchange or Other Taxable Disposition of Common Stock.” Any distribution described in this paragraph would also be subject to the discussion below in “—Foreign Account Tax Compliance Act.”
Subject to the exceptions described below, dividends paid to a non-U.S. holder generally will be subject to withholding of U.S. federal income tax at a 30% rate or such lower rate as may be specified by an applicable income tax treaty between the United States and such holder’s country of residence. If we determine, at a time reasonably close to the date of payment of a distribution on shares of our common stock, that the distribution will not constitute a dividend because we do not anticipate having current or accumulated earnings and profits, we intend not to withhold any U.S. federal income tax on the distribution as permitted by U.S. Treasury Regulations.
Dividends that are treated as effectively connected with a trade or business conducted by a non-U.S. holder within the United States, and, if an applicable income tax treaty so provides, that are attributable to a permanent establishment or a fixed base maintained by the non-U.S. holder within the United States, are generally exempt from the 30% withholding tax if the non-U.S. holder satisfies applicable certification and disclosure requirements. To obtain this exemption, a non-US holder must provide us with a properly executed original and unexpired IRS Form W-8ECI properly certifying such exemption. However, such U.S. effectively connected income, net of specified deductions and credits, is taxed at the same graduated U.S. federal income tax rates applicable to U.S. persons (as defined in the Internal Revenue Code). Any U.S. effectively connected income received by a non-U.S. holder that is treated as a corporation for U.S. federal income tax purposes may also, under certain circumstances, be subject to an additional “branch profits tax” at a 30% rate or such lower rate as may be specified by an applicable income tax treaty between the United States and such holder’s country of residence.
A non-U.S. holder of shares of our common stock who claims the benefit of an applicable income tax treaty between the United States and such holder’s country of residence generally will be required to provide a properly executed IRS Form W-8BEN (or successor form) and satisfy applicable certification and other requirements. Non-U.S. holders are urged to consult their own tax advisors regarding their entitlement to benefits under a relevant income tax treaty.
A non-U.S. holder that is eligible for a reduced rate of U.S. withholding tax under an income tax treaty may obtain a refund or credit of any excess amounts withheld by timely filing an appropriate claim with the IRS.
Gain on Sale, Exchange or Other Taxable Disposition of Common Stock
Subject to the discussion below in “—Foreign Account Tax Compliance Act,” a non-U.S. holder generally will not be subject to U.S. federal income tax on gain recognized on a sale, exchange or other taxable disposition of shares of our common stock unless:
| • | the gain is effectively connected with the non-U.S. holder’s conduct of a trade or business in the United States, and, if an applicable income tax treaty so provides, the gain is attributable to a permanent establishment maintained by the non-U.S. holder in the United States; in these cases, the non-U.S. holder will be taxed on a net income basis at the regular graduated rates and in the manner applicable to U.S. persons, and, if the non-U.S. holder is a non-U.S. corporation, an additional branch profits tax at a rate of 30%, or a lower rate as may be specified by an applicable income tax treaty, may also apply; |
129
| • | the non-U.S. holder is an individual present in the United States for 183 days or more in the taxable year of the disposition and certain other conditions are met, in which case the non-U.S. holder will be subject to a 30% tax (or such lower rate as may be specified by an applicable income tax treaty) on the amount by which such non-U.S. holder’s capital gains allocable to U.S. sources exceed capital losses allocable to U.S. sources during the taxable year of the disposition; or |
| • | we are or were a “U.S. real property holding corporation” during the shorter of the five-year period ending on the date of the disposition or the period that the non-U.S. holder held our common stock. Generally, a corporation is a “U.S. real property holding corporation” if the fair market value of its “U.S. real property interests” (within the meaning of the Internal Revenue Code) equals or exceeds 50% of the sum of the fair market value of its worldwide real property interests plus its other assets used or held for use in a trade or business. We believe that we are not currently, and we do not anticipate becoming, a “U.S. real property holding corporation” for U.S. federal income tax purposes. |
Information Reporting and Backup Withholding Tax
We must report annually to the IRS and to each non-U.S. holder the gross amount of the distributions on shares of our common stock paid to such holder and the tax withheld, if any, with respect to such distributions. These information reporting requirements apply even if withholding is not required. Subject to the discussion below under “—Foreign Account Tax Compliance Act,” non-U.S. holders may have to comply with specific certification procedures to establish that the holder is not a U.S. person (as defined in the Internal Revenue Code) or otherwise subject to an exemption in order to avoid backup withholding at the applicable rate (currently 28%) with respect to dividends on shares of our common stock. Generally, a holder will comply with such procedures if it provides a properly executed IRS Form W-8BEN or otherwise meets documentary evidence requirements for establishing that it is a non-U.S. holder, or otherwise establishes an exemption. Dividends paid to non-U.S. holders subject to the U.S. federal withholding tax, as described above in “—Dividends,” generally will be exempt from U.S. backup withholding.
Information reporting and backup withholding generally will apply to the payment of the proceeds of a disposition of shares of our common stock by a non-U.S. holder effected by or through the U.S. office of any broker, U.S. or non-U.S., unless the holder certifies that it is a non-U.S. person (as defined in the Internal Revenue Code) and satisfies certain other requirements, or otherwise establishes an exemption. For information reporting purposes, dispositions effected through a non-U.S. office of a broker with substantial U.S. ownership or operations generally will be treated in a manner similar to dispositions effected through a U.S. office of a broker and dispositions otherwise effected through a non-U.S. office generally will not be subject to information reporting. Generally, backup withholding will not apply to a payment of disposition proceeds to a non-U.S. holder where the transaction is effected through a non-U.S. office of a U.S. broker or non-U.S. office of a non-U.S. broker. Non-U.S. holders should consult their own tax advisors regarding the application of the information reporting and backup withholding rules to them.
Copies of information returns may be made available to the tax authorities of the country in which the non-U.S. holder resides or is incorporated under the provisions of a specific treaty or agreement.
Backup withholding is not an additional tax. Any amounts withheld under the backup withholding rules from a payment to a non-U.S. holder can be refunded or credited against the non-U.S. holder’s U.S. federal income tax liability, if any, provided that an appropriate claim is timely filed with the IRS.
Foreign Account Tax Compliance Act
Legislation enacted in March 2010, commonly referred to as FATCA, generally will impose a U.S. federal withholding tax of 30% on payments to certain non-U.S. entities (including certain intermediaries), including dividends on and the gross proceeds from a sale or other disposition of our common stock, unless such persons comply with a complicated U.S. information reporting, due diligence, disclosure and certification regime. This new regime and its requirements are different from, and in addition to, the certification requirements described elsewhere in this discussion. The FATCA withholding rules apply to certain payments, including dividend payments on our common stock, if any, paid after December 31, 2013, and to payments of gross proceeds from
130
the sale or other dispositions of our common stock paid after December 31, 2016. Although administrative guidance and proposed regulations have been issued, regulations implementing the new FATCA regime have not been finalized and the exact scope of these rules remains unclear and potentially subject to material changes. Prospective investors should consult their own tax advisors regarding the possible impact of these rules on their investment in our common stock, including any investment in our common stock made through another entity.
Federal Estate Tax
Common stock owned or treated as owned by an individual who is a non-U.S. holder (as specially defined for U.S. federal estate tax purposes) at the time of such non-U.S. holder’s death will be included in the individual’s gross estate for U.S. federal estate tax purposes and, therefore, may be subject to U.S. federal estate tax, unless an applicable estate tax or other treaty provides otherwise. Generally, amounts included in the taxable estate of decedents are subject to U.S. federal estate tax at a maximum rate of 40%.
The preceding discussion of material U.S. federal tax considerations is for general information only. It is not tax advice. Prospective investors should consult their own tax advisors regarding the particular U.S. federal, state, local and non-U.S. tax consequences of purchasing, holding and disposing of shares of our common stock, including the consequences of any proposed changes in applicable laws.
131
JMP Securities LLC is acting as representative of the underwriters named below. Subject to the terms and conditions set forth in an underwriting agreement dated the date of this prospectus, each of the underwriters named below has severally agreed to purchase from us the aggregate number of shares of common stock set forth opposite their respective names below:
| Underwriters |
Number of Shares | |||
| JMP Securities LLC |
2,722,222 | |||
| Needham & Company, LLC |
777,778 | |||
|
|
|
|||
| Total |
3,500,000 | |||
|
|
|
|||
The underwriting agreement provides that the obligations of the several underwriters are subject to various conditions, including approval of legal matters by counsel. The nature of the underwriters’ obligations commits them to purchase and pay for all of the shares of common stock listed above if any are purchased. The underwriters reserve the right to withdraw, cancel or modify offers to the public and to reject orders in whole or in part.
The underwriters expect to deliver the shares of common stock to purchasers on or about February 19, 2014.
Option to Purchase Additional Shares
We have granted a 30-day option to the underwriters to purchase up to a total of 525,000 additional shares of our common stock from us at the initial public offering price, less the underwriting discount payable by us, as set forth on the cover page of this prospectus. If the underwriters exercise this option in whole or in part, then each of the underwriters will be separately committed, subject to the conditions described in the underwriting agreement, to purchase the additional shares of our common stock in proportion to their respective commitments set forth in the table above.
Determination of Offering Price
Prior to this offering, there has been no public market for our common stock. The initial public offering price was determined through negotiations between us and the representative. In addition to currently prevailing general conditions in the equity securities markets, including current market valuations of publicly traded companies considered comparable to our company, the factors we considered in determining the initial public offering price included our results of operations, our current financial condition, our future prospects, our management, our markets, the economic conditions in and future prospects for the industry in which we compete and other factors we deem relevant. We cannot assure you that an active or orderly trading market will develop for our common stock or that our common stock will trade in the public markets subsequent to this offering at or above the initial public offering price.
Commissions and Discounts
The underwriters propose to offer the shares of common stock directly to the public at the initial public offering price set forth on the cover page of this prospectus, and at this price less a concession not in excess of $0.2415 per share of common stock to other dealers specified in a master agreement among underwriters who are members of the Financial Industry Regulatory Authority, Inc. After this offering, the offering price, concessions, and other selling terms may be changed by the underwriters. Our common stock is offered subject to receipt and acceptance by the underwriters and to the other conditions, including the right to reject orders in whole or in part.
132
The following table summarizes the compensation to be paid to the underwriters by us and the proceeds, before expenses, payable to us:
| Per Share | Total | |||||||||||
| Without Option to Purchase Additional Shares |
With Option to Purchase Additional Shares |
|||||||||||
| Public offering price |
$ | 5.75 | $ | 20,125,000 | $ | 23,143,750 | ||||||
| Underwriting discount |
0.4025 | 1,408,750 | 1,620,062 | |||||||||
| Proceeds, before expenses, to us |
5.3475 | 18,716,250 | 21,523,687 | |||||||||
We estimate that the total expenses of this offering, excluding underwriting discounts and commissions, will be $3.7 million, all of which will be paid by us. We have also agreed to reimburse the underwriters for certain of their expenses totaling approximately $370,000 as set forth in the underwriting agreement.
JMP Securities LLC has agreed to pay Inverness Advisors, a division of KEMA Partners LLC, an amount equal to: ten percent of the total underwriting discount less ten percent of the offering-related expenses, including legal counsel fees, of the underwriters. This amount will be paid on our behalf in consideration of the following advisory services provided to us in connection with this offering:
| • | advising with respect to our strategic approach to the offering and the structure, terms and timing of the offering; |
| • | participating in the preparation of this prospectus; and |
| • | providing such other general financial advisory services as may from time to time be agreed upon by Inverness and us. |
In addition we have separately agreed to pay Inverness Advisors a financial advisory fee upon the closing of this offering of $175,000 if the gross proceeds from this offering are less than $30 million or $150,000 if the gross proceeds from this offering are equal to or greater than $30 million. KEMA Partners LLC is a FINRA member and SEC-registered broker-dealer. KEMA Partners LLC, including its division Inverness Advisors, is not acting as an underwriter and will not sell or offer to sell any securities or identify, solicit or engage directly with potential investors. In addition, KEMA Partners LLC, including its division Inverness Advisors, will not underwrite or purchase any of the offered securities or otherwise participate in any such undertaking.
Indemnification of Underwriters
We will indemnify the underwriters against some civil liabilities, including liabilities under the Securities Act and liabilities arising from breaches of our representations and warranties contained in the underwriting agreement. If we are unable to provide this indemnification, we will contribute to payments the underwriters may be required to make in respect of those liabilities.
No Sales of Similar Securities
The underwriters will require all of our directors and officers and substantially all of our stockholders to agree not to offer, sell, agree to sell, directly or indirectly, or otherwise dispose of any shares of common stock or any securities convertible into or exchangeable for shares of common stock without the prior written consent of JMP Securities LLC for a period of 180 days after the date of this prospectus, subject to specified limited exceptions. JMP Securities LLC in its sole discretion may release any of the securities subject to these agreements at any time, which, in the case of officers and directors, shall be with notice.
We have agreed that for a period of 180 days after the date of this prospectus, we will not, without the prior written consent of JMP Securities LLC, offer, sell or otherwise dispose of any shares of common stock, except for the shares of common stock offered in this offering, the shares of common stock issuable upon exercise of outstanding options on the date of this prospectus and other specified limited exceptions.
NASDAQ Capital Market Listing
Our common stock has been approved for listing on The NASDAQ Capital Market under the symbol “AMDA.”
133
Short Sales, Stabilizing Transactions, and Penalty Bids
In order to facilitate this offering, persons participating in this offering may engage in transactions that stabilize, maintain, or otherwise affect the price of our common stock during and after this offering. Specifically, the underwriters may engage in the following activities in accordance with the rules of the Securities and Exchange Commission.
Short sales. Short sales involve the sales by the underwriters of a greater number of shares than they are required to purchase in the offering. Covered short sales are short sales made in an amount not greater than the underwriters’ option to purchase additional shares from us in this offering. The underwriters may close out any covered short position by either exercising their option to purchase shares or purchasing shares in the open market. In determining the source of shares to close out the covered short position, the underwriters will consider, among other things, the price of shares available for purchase in the open market as compared to the price at which they may purchase shares through the option to purchase additional shares. Naked short sales are any short sales in excess of such option. The underwriters must close out any naked short position by purchasing shares in the open market. A naked short position is more likely to be created if the underwriters are concerned that there may be downward pressure on the price of the common stock in the open market after pricing that could adversely affect investors who purchase in this offering.
Stabilizing transactions. The underwriters may make bids for or purchases of the shares for the purpose of pegging, fixing, or maintaining the price of the shares, so long as stabilizing bids do not exceed a specified maximum.
Penalty bids. If the underwriters purchase shares in the open market in a stabilizing transaction or syndicate covering transaction, they may reclaim a selling concession from the underwriters and selling group members who sold those shares as part of this offering. Stabilization and syndicate covering transactions may cause the price of the shares to be higher than it would be in the absence of these transactions. The imposition of a penalty bid might also have an effect on the price of the shares if it discourages presales of the shares.
The transactions above may occur on The NASDAQ Capital Market or otherwise. Neither we nor the underwriters make any representation or prediction as to the effect that the transactions described above may have on the price of the shares. If these transactions are commenced, they may be discontinued without notice at any time.
Discretionary Sales
The underwriters have informed us that they do not expect to confirm sales of common stock offered by this prospectus to accounts over which they exercise discretionary authority without obtaining the specific approval of the account holder.
Electronic Distribution
A prospectus in electronic format may be made available on the internet sites or through other online services maintained by one or more of the underwriters participating in this offering, or by their affiliates. Other than the prospectus in electronic format, the information on any underwriter’s website and any information contained in any other website maintained by an underwriter is not part of the prospectus or the registration statement of which this prospectus forms a part, has not been approved or endorsed by us or any underwriter in its capacity as underwriter and should not be relied upon by investors.
Relationships
The underwriters and their respective affiliates are full service financial institutions engaged in various activities, which may include securities trading, commercial and investment banking, financial advisory, investment management, principal investment, hedging, financing and brokerage activities. Certain of the underwriters and their affiliates have in the past provided, and may in the future from time to time provide, investment banking and other financing and banking services to us, for which they have in the past received, and may in the future receive, customary fees and reimbursement for their expenses. In the ordinary course of their various business activities, the underwriters and their respective affiliates may make or hold a broad array of investments and actively trade debt and equity securities (or related derivative securities) and financial
134
instruments including bank loans for their own account and for the accounts of their customers and may at any time hold long and short positions in such securities and instruments. Such investment and securities activities may involve our securities and instruments.
European Economic Area
In relation to each member state of the European Economic Area that has implemented the Prospectus Directive (each, a relevant member state), with effect from and including the date on which the Prospectus Directive is implemented in that relevant member state (the relevant implementation date), an offer of securities described in this prospectus may not be made to the public in that relevant member state other than:
| • | to any legal entity that is authorized or regulated to operate in the financial markets or, if not so authorized or regulated, whose corporate purpose is solely to invest in securities; |
| • | to any legal entity that has two or more of (1) an average of at least 250 employees during the last financial year; (2) a total balance sheet of more than €43,000,000 and (3) an annual net turnover of more than €50,000,000, as shown in its last annual or consolidated accounts; |
| • | to fewer than 100 natural or legal persons (other than qualified investors as defined in the Prospectus Directive) subject to obtaining the prior consent of the representative; or |
| • | in any other circumstances that do not require the publication of a prospectus pursuant to Article 3 of the Prospectus Directive, |
provided that no such offer of securities shall require us or any underwriter to publish a prospectus pursuant to Article 3 of the Prospectus Directive. For purposes of this provision, the expression an “offer of securities to the public” in any relevant member state means the communication in any form and by any means of sufficient information on the terms of the offer and the securities to be offered so as to enable an investor to decide to purchase or subscribe the securities, as the expression may be varied in that member state by any measure implementing the Prospectus Directive in that member state, and the expression “Prospectus Directive” means Directive 2003/71/EC and includes any relevant implementing measure in each relevant member state.
We have not authorized and do not authorize the making of any offer of securities through any financial intermediary on their behalf, other than offers made by the underwriters with a view to the final placement of the securities as contemplated in this prospectus. Accordingly, no purchaser of the securities, other than the underwriters, is authorized to make any further offer of the securities on behalf of us or the underwriters.
United Kingdom
This prospectus is only being distributed to, and is only directed at, persons in the United Kingdom that are qualified investors within the meaning of Article 2(1)(e) of the Prospectus Directive (Qualified Investors) that are also (i) investment professionals falling within Article 19(5) of the Financial Services and Markets Act 2000 (Financial Promotion) Order 2005 (the Order) or (ii) high net worth entities, and other persons to whom it may lawfully be communicated, falling within Article 49(2)(a) to (d) of the Order (all such persons together being referred to as relevant persons). This prospectus and its contents are confidential and should not be distributed, published or reproduced (in whole or in part) or disclosed by recipients to any other persons in the United Kingdom. Any person in the United Kingdom that is not a relevant person should not act or rely on this document or any of its contents.
France
This prospectus has not been prepared in the context of a public offering of financial securities in France within the meaning of Article L.411-1 of the French Code Monétaire et Financier and Title I of Book II of the Reglement Général of the Autorité des marchés financiers (the AMF) and therefore has not been and will not be filed with the AMF for prior approval or submitted for clearance to the AMF. Consequently, the shares of our common stock may not be, directly or indirectly, offered or sold to the public in France and offers and sales of the shares of our common stock may only be made in France to qualified investors (investisseurs qualifiés) acting for their own account, as defined in and in accordance with Articles L.411-2 and D.411-1 to D.411-4, D.734-1, D.744-1, D.754-1 and D.764-1 of the French Code Monétaire et Financier. Neither this prospectus nor any other
135
offering material may be released, issued or distributed to the public in France or used in connection with any offer for subscription on sale of the shares of our common stock to the public in France. The subsequent direct or indirect retransfer of the shares of our common stock to the public in France may only be made in compliance with Articles L.411-1, L.411-2, L.412-1 and L.621-8 through L.621-8-3 of the French Code Monétaire et Financier.
Notice to Residents of Germany
Each person who is in possession of this prospectus is aware of the fact that no German securities prospectus (wertpapierprospekt) within the meaning of the securities prospectus act (wertpapier-prospektgesetz, the act) of the federal republic of Germany has been or will be published with respect to the shares of our common stock. In particular, each underwriter has represented that it has not engaged and has agreed that it will not engage in a public offering in the federal republic of Germany (ôffertliches angebot) within the meaning of the act with respect to any of the shares of our common stock otherwise than in accordance with the act and all other applicable legal and regulatory requirements.
Notice to Residents of Switzerland
The securities which are the subject of the offering contemplated by this prospectus may not be publicly offered in Switzerland and will not be listed on the SIX Swiss Exchange, or SIX, or on any other stock exchange or regulated trading facility in Switzerland. This prospectus has been prepared without regard to the disclosure standards for issuance prospectuses under art. 652a or art. 1156 of the Swiss Code of Obligations or the disclosure standards for listing prospectuses under art. 27 ff. of the SIX Listing Rules or the listing rules of any other stock exchange or regulated trading facility in Switzerland. None of this prospectus or any other offering or marketing material relating to the securities or the offering may be publicly distributed or otherwise made publicly available in Switzerland.
None of this prospectus or any other offering or marketing material relating to the offering, us or the securities have been or will be filed with or approved by any Swiss regulatory authority. In particular, this prospectus will not be filed with, and the offer of securities will not be supervised by, the Swiss Financial Market Supervisory Authority, or FINMA and the offer of securities has not been and will not be authorized under the Swiss Federal Act on Collective Investment Schemes, or CISA. The investor protection afforded to acquirers of interests in collective investment schemes under the CISA does not extend to acquirers of the securities.
Notice to Residents of the Netherlands
The offering of the shares of our common stock is not a public offering in The Netherlands. The shares of our common stock may not be offered or sold to individuals or legal entities in The Netherlands unless (i) a prospectus relating to the offer is available to the public, which has been approved by the Dutch Authority for the Financial Markets (Autoriteit Financiële Markten) or by the competent supervisory authority of another state that is a member of the European Union or party to the Agreement on the European Economic Area, as amended or (ii) an exception or exemption applies to the offer pursuant to Article 5:3 of The Netherlands Financial Supervision Act (Wet op het financieel toezicht) or Article 53 paragraph 2 or 3 of the Exemption Regulation of the Financial Supervision Act, for instance due to the offer targeting exclusively “qualified investors” (gekwalificeerde beleggers) within the meaning of Article 1:1 of The Netherlands Financial Supervision Act.
Notice to Residents of Japan
The underwriters will not offer or sell any of the shares of our common stock directly or indirectly in Japan or to, or for the benefit of, any Japanese person or to others, for re-offering or re-sale directly or indirectly in Japan or to any Japanese person, except in each case pursuant to an exemption from the registration requirements of, and otherwise in compliance with, the Financial Instruments and Exchange Law of Japan and any other applicable laws and regulations of Japan. For purposes of this paragraph, “Japanese person” means any person resident in Japan, including any corporation or other entity organized under the laws of Japan.
136
Notice to Residents of Hong Kong
The underwriters and each of their affiliates have not (1) offered or sold, and will not offer or sell, in Hong Kong, by means of any document, any shares of our common stock other than (a) to “professional investors” within the meaning of the Securities and Futures Ordinance (Cap. 571) of Hong Kong and any rules made under that Ordinance or (b) in other circumstances which do not result in the document being a “prospectus” as defined in the Companies Ordinance (Cap. 32) of Hong Kong or which do not constitute an offer to the public within the meaning of that Ordinance; and (2) issued or had in its possession for the purposes of issue, and will not issue or have in its possession for the purposes of issue, whether in Hong Kong or elsewhere any advertisement, invitation or document relating to the shares of our common stock which is directed at, or the contents of which are likely to be accessed or read by, the public in Hong Kong (except if permitted to do so under the securities laws of Hong Kong) other than with respect to the shares of our common stock which are or are intended to be disposed of only to persons outside Hong Kong or only to “professional investors” within the meaning of the Securities and Futures Ordinance and any rules made under that Ordinance. The contents of this document have not been reviewed by any regulatory authority in Hong Kong. You are advised to exercise caution in relation to the offer. If you are in any doubt about any of the contents of this document, you should obtain independent professional advice.
Notice to Residents of Singapore
This document has not been registered as a prospectus with the Monetary Authority of Singapore. Accordingly, this document and any other document or material in connection with the offer or sale, or invitation for subscription or purchase, of shares of our common stock may not be circulated or distributed, nor may shares of our common stock be offered or sold, or be made the subject of an invitation for subscription or purchase, whether directly or indirectly, to persons in Singapore other than (i) to an institutional investor under Section 274 of the Securities and Futures Act, Chapter 289 of Singapore (the Securities and Futures Act), (ii) to a relevant person, or any person pursuant to Section 275(1A), and in accordance with the conditions, specified in Section 275 of the Securities and Futures Act or (iii) otherwise pursuant to, and in accordance with the conditions of, any other applicable provision of the Securities and Futures Act.
Where shares of our common stock are subscribed or purchased under Section 275 by a relevant person, which is:
(a) a corporation (which is not an accredited investor) the sole business of which is to hold investments and the entire share capital of which is owned by one or more individuals, each of whom is an accredited investor; or
(b) a trust (where the trustee is not an accredited investor) whose sole purpose is to hold investments and each beneficiary is an accredited investor,
shares, debentures and units of shares and debentures of that corporation or the beneficiaries’ rights and interest in that trust shall not be transferable for six months after that corporation or that trust has acquired the shares of our common stock under Section 275 except:
(1) to an institutional investor or to a relevant person, or to any person pursuant to an offer that is made on terms that such rights or interest are acquired at a consideration of not less than $200,000 (or its equivalent in a foreign currency) for each transaction, whether such amount is to be paid for in cash or by exchange of securities or other assets;
(2) where no consideration is given for the transfer; or
(3) by operation of law.
137
The validity of the issuance of the common stock offered by us in this offering will be passed upon for us by Mintz, Levin, Cohn, Ferris, Glovsky and Popeo, P.C., Boston, Massachusetts. Certain legal matters relating to this offering will be passed upon for the underwriters by Cooley LLP, New York, New York.
The consolidated financial statements of Amedica Corporation at December 31, 2012 and 2011, and for each of the two years in the period ended December 31, 2012, appearing in this prospectus have been audited by Ernst & Young LLP, independent registered public accounting firm, as set forth in their report thereon (which contains an explanatory paragraph describing conditions that raise substantial doubt about our ability to continue as a going concern as described in Note 1 to the consolidated financial statements) appearing elsewhere herein, and are included in reliance upon such report given on the authority of such firm as experts in accounting and auditing.
WHERE YOU CAN FIND ADDITIONAL INFORMATION
We have filed with the SEC a registration statement on Form S-1 under the Securities Act, with respect to the common stock offered by this prospectus. This prospectus, which is part of the registration statement, omits certain information, exhibits, schedules and undertakings set forth in the registration statement. For further information pertaining to us and our common stock, reference is made to the registration statement and the exhibits and schedules to the registration statement. Statements contained in this prospectus as to the contents or provisions of any documents referred to in this prospectus are not necessarily complete, and in each instance where a copy of the document has been filed as an exhibit to the registration statement, reference is made to the exhibit for a more complete description of the matters involved.
You may read and copy all or any portion of the registration statement without charge at the public reference room of the SEC at 100 F Street, N.E., Washington, D.C. 20549. Copies of the registration statement may be obtained from the SEC at prescribed rates from the public reference room of the SEC at such address. You may obtain information regarding the operation of the public reference room by calling 1-800-SEC-0330. In addition, registration statements and certain other filings made with the SEC electronically are publicly available through the SEC’s web site at http://www.sec.gov. The registration statement, including all exhibits and amendments to the registration statement, has been filed electronically with the SEC.
Upon completion of this offering, we will become subject to the information and periodic reporting requirements of the Exchange Act and, accordingly, will file annual reports containing financial statements audited by an independent public accounting firm, quarterly reports containing unaudited financial data, current reports, proxy statements and other information with the SEC. You will be able to inspect and copy such periodic reports, proxy statements and other information at the SEC’s public reference room, and the web site of the SEC referred to above. We will also maintain a web site at http://www.amedica.com, at which you may access these materials free of charge as soon as reasonably practicable after they are electronically filed with, or furnished to, the SEC. The information contained in, or that can be accessed through, our web site is not part of this prospectus.
138
INDEX TO CONSOLIDATED FINANCIAL STATEMENTS
Years ended December 31, 2011 and 2012 (audited) and Nine Months ended September 30, 2012 and 2013 (unaudited)
| F-2 | ||||
| F-3 | ||||
| F-4 | ||||
| Consolidated Statements of Convertible Preferred Stock and Stockholders’ Deficit |
F-5 | |||
| F-6 | ||||
| F-7 |
F-1
Report of Independent Registered Public Accounting Firm
The Board of Directors and Shareholders of
Amedica Corporation
We have audited the accompanying consolidated balance sheets of Amedica Corporation as of December 31, 2012 and 2011, and the related consolidated statements of comprehensive loss, statements of convertible preferred stock and stockholders’ deficit, and cash flows for each of the two years in the period ended December 31, 2012. These financial statements are the responsibility of the Company’s management. Our responsibility is to express an opinion on these financial statements based on our audits.
We conducted our audits in accordance with the standards of the Public Company Accounting Oversight Board (United States). Those standards require that we plan and perform the audit to obtain reasonable assurance about whether the financial statements are free of material misstatement. We were not engaged to perform an audit of the Company’s internal control over financial reporting. Our audits included consideration of internal control over financial reporting as a basis for designing audit procedures that are appropriate in the circumstances, but not for the purpose of expressing an opinion on the effectiveness of the Company’s internal control over financial reporting. Accordingly, we express no such opinion. An audit also includes examining, on a test basis, evidence supporting the amounts and disclosures in the financial statements, assessing the accounting principles used and significant estimates made by management, and evaluating the overall financial statement presentation. We believe that our audits provide a reasonable basis for our opinion.
In our opinion, the financial statements referred to above present fairly, in all material respects, the consolidated financial position of Amedica Corporation at December 31, 2012 and 2011, and the consolidated results of its operations and its cash flows for each of the two years in the period ended December 31, 2012, in conformity with U.S. generally accepted accounting principles.
The accompanying consolidated financial statements have been prepared assuming that the Company will continue as a going concern. As discussed in Note 1 to the financial statements, the Company has recurring losses from operations and has a net capital deficiency that raise substantial doubt about its ability to continue as a going concern. Management’s plans in regard to these matters are also described in Note 1. The consolidated financial statements do not include any adjustments that might result from the outcome of this uncertainty.
/s/ Ernst & Young LLP
Salt Lake City, Utah
September 23, 2013, except for the last paragraph of Note 1,
as to which the date is February 11, 2014
F-2
AMEDICA CORPORATION
| December 31, 2011 |
December 31, 2012 |
September 30, 2013 |
Pro Forma September 30, 2013 |
|||||||||||||
| (unaudited) | ||||||||||||||||
| Assets |
||||||||||||||||
| Current assets: |
||||||||||||||||
| Cash and cash equivalents |
$ | 3,330,932 | $ | 2,741,300 | $ | 7,562,400 | $ | 7,562,400 | ||||||||
| Restricted cash |
— | 260,459 | 298,493 | 298,493 | ||||||||||||
| Marketable securities |
7,808,644 | 2,680,441 | — | — | ||||||||||||
| Trade accounts receivable, net of allowance of $284,272 and $58,346 and $136,749, respectively |
3,446,673 | 4,015,721 | 2,344,036 | 2,344,036 | ||||||||||||
| Prepaid expenses and other current assets |
1,702,281 | 519,238 | 491,752 | 491,752 | ||||||||||||
| Deferred offering costs |
— | — | 1,348,004 | 1,348,004 | ||||||||||||
| Inventories |
11,397,306 | 8,825,894 | 9,210,296 | 9,210,296 | ||||||||||||
|
|
|
|
|
|
|
|
|
|||||||||
| Total current assets |
27,685,836 | 19,043,053 | 21,254,981 | 21,254,981 | ||||||||||||
| Property and equipment, net |
4,979,194 | 3,022,532 | 3,302,998 | 3,302,998 | ||||||||||||
| Indefinite lived intangible assets |
2,249,000 | 350,000 | 350,000 | 350,000 | ||||||||||||
| Amortizable intangible assets |
20,105,778 | 4,839,000 | 4,463,560 | 4,463,560 | ||||||||||||
| Goodwill |
6,162,565 | 6,162,565 | 6,162,565 | 6,162,565 | ||||||||||||
| Other long-term assets |
37,794 | 37,794 | 35,000 | 35,000 | ||||||||||||
|
|
|
|
|
|
|
|
|
|||||||||
| Total assets |
$ | 61,220,167 | $ | 33,454,944 | $ | 35,569,104 | $ | 35,569,104 | ||||||||
|
|
|
|
|
|
|
|
|
|||||||||
| Liabilities and stockholders’ deficit |
||||||||||||||||
| Current liabilities: |
||||||||||||||||
| Accounts payable |
$ | 1,389,230 | $ | 2,142,411 | $ | 3,088,671 | $ | 3,088,671 | ||||||||
| Accrued liabilities |
1,872,597 | 1,599,313 | 1,931,988 | 1,931,988 | ||||||||||||
| Deferred rent |
19,756 | 7,084 | 25,226 | 25,226 | ||||||||||||
| Deferred revenue |
4,720 | — | — | — | ||||||||||||
| Line of credit |
2,000,000 | 2,572,929 | — | — | ||||||||||||
| Contingent consideration, current |
6,800,010 | — | — | — | ||||||||||||
| Current portion of long-term debt |
2,857,634 | 17,892,759 | 17,916,609 | 17,916,609 | ||||||||||||
|
|
|
|
|
|
|
|
|
|||||||||
| Total current liabilities |
14,943,947 | 24,214,496 | 22,962,494 | 22,962,494 | ||||||||||||
| Deferred rent |
571,975 | 605,931 | 583,339 | 583,339 | ||||||||||||
| Long-term accrued liabilities |
860,000 | 134,000 | 134,000 | 134,000 | ||||||||||||
| Preferred stock warrant liability |
328,949 | 525,479 | 452,331 | — | ||||||||||||
| Common stock warrant liability |
2,164,935 | 2,783,191 | 3,877,230 | 3,877,230 | ||||||||||||
| Long-term debt |
15,500,000 | — | — | — | ||||||||||||
| Convertible debt |
23,628,289 | — | — | — | ||||||||||||
| Commitments and contingencies |
||||||||||||||||
| Convertible preferred stock, $0.01 par value: |
||||||||||||||||
| Authorized shares—100,000,000 at December 31, 2011 and 2012 and September 30, 2013 (unaudited); issued and outstanding shares—57,882,889 and 76,170,394 at December 31, 2011 and 2012, and 80,910,394 at September 30, 2013 (unaudited); liquidation preference—$104,000,000 and $140,000,000 at December 31, 2011 and 2012 and $150,000,000 at September 30, 2013 (unaudited); no shares issued and outstanding, pro forma (unaudited) |
117,501,194 | 153,474,317 | 161,455,812 | — | ||||||||||||
| Stockholders’ deficit: |
||||||||||||||||
| Common stock, $0.01 par value: |
||||||||||||||||
| Authorized shares—150,000,000 at December 31, 2011 and 2012 and September 30, 2013 (unaudited); issued and outstanding shares—348,186 and 348,636 at December 31, 2011 and 2012, and 597,675 at September 30, 2013 (unaudited); 8,627,454 shares issued and outstanding, pro forma (unaudited) |
3,482 | 3,487 | 5,977 | 86,275 | ||||||||||||
| Additional paid-in capital / (capital deficiency) |
(17,657,476 | ) | (16,650,977 | ) | (13,317,024 | ) | 148,510,821 | |||||||||
| Accumulated other comprehensive income (loss) |
(23,033 | ) | 1,784 | — | — | |||||||||||
| Accumulated deficit |
(96,602,095 | ) | (131,636,764 | ) | (140,585,055 | ) | (140,585,055 | ) | ||||||||
|
|
|
|
|
|
|
|
|
|||||||||
| Total stockholders’ equity (deficit) |
(114,279,122 | ) | (148,282,470 | ) | (153,896,102 | ) | 8,012,041 | |||||||||
|
|
|
|
|
|
|
|
|
|||||||||
| Total liabilities, convertible preferred stock and stockholders’ equity (deficit) |
$ | 61,220,167 | $ | 33,454,944 | $ | 35,569,104 | $ | 35,569,104 | ||||||||
|
|
|
|
|
|
|
|
|
|||||||||
See accompanying notes.
F-3
AMEDICA CORPORATION
Consolidated Statements of Comprehensive Loss
| Years Ended December 31, | Nine Months Ended September 30, | |||||||||||||||
| 2011 | 2012 | 2012 | 2013 | |||||||||||||
| (unaudited) | ||||||||||||||||
| Product revenue |
$ | 20,261,455 | $ | 23,065,272 | $ | 17,126,394 | $ | 16,603,662 | ||||||||
| Cost of revenue |
||||||||||||||||
| Product revenue |
4,088,166 | 5,422,805 | 3,363,478 | 4,234,726 | ||||||||||||
| Write-down of excess and obsolete inventory |
— | 1,042,909 | — | 777,699 | ||||||||||||
|
|
|
|
|
|
|
|
|
|||||||||
| Total cost of revenue |
4,088,166 | 6,465,714 | 3,363,478 | 5,012,425 | ||||||||||||
| Operating expenses |
||||||||||||||||
| Research and development |
7,789,216 | 6,013,400 | 4,488,259 | 2,866,407 | ||||||||||||
| General and administrative |
7,263,045 | 7,312,997 | 5,457,789 | 4,067,066 | ||||||||||||
| Sales and marketing |
17,145,515 | 17,094,177 | 11,944,210 | 12,123,109 | ||||||||||||
| Impairment loss on intangible assets |
— | 15,280,861 | — | — | ||||||||||||
| Change in fair value of contingent consideration |
4,831,609 | — | — | — | ||||||||||||
|
|
|
|
|
|
|
|
|
|||||||||
| Total operating expenses |
37,029,385 | 45,701,435 | 21,890,258 | 19,056,582 | ||||||||||||
| Loss from operations |
(20,856,096 | ) | (29,101,877 | ) | (8,127,342 | ) | (7,465,345 | ) | ||||||||
| Other income (expense) |
||||||||||||||||
| Interest income |
71,775 | 57,444 | 45,380 | 12,920 | ||||||||||||
| Interest expense |
(3,455,811 | ) | (5,610,926 | ) | (3,863,642 | ) | (1,345,055 | ) | ||||||||
| Loss on extinguishment of debt |
— | (250,678 | ) | — | — | |||||||||||
| Change in fair value of preferred stock warrants |
307,890 | (85,228 | ) | (109,804 | ) | 73,149 | ||||||||||
| Change in fair value of common stock warrants |
172,381 | (618,256 | ) | 1,348,000 | (223,525 | ) | ||||||||||
| Other income / (expense) |
8,691 | (151,148 | ) | (4,087 | ) | (435 | ) | |||||||||
|
|
|
|
|
|
|
|
|
|||||||||
| Total other expense |
(2,895,074 | ) | (6,658,792 | ) | (2,584,153 | ) | (1,482,946 | ) | ||||||||
|
|
|
|
|
|
|
|
|
|||||||||
| Net loss before income taxes |
(23,751,170 | ) | (35,760,669 | ) | (10,711,495 | ) | (8,948,291 | ) | ||||||||
| Income tax benefit |
— | 726,000 | — | — | ||||||||||||
|
|
|
|
|
|
|
|
|
|||||||||
| Net loss |
(23,751,170 | ) | (35,034,669 | ) | (10,711,495 | ) | (8,948,291 | ) | ||||||||
| Other comprehensive loss, net of tax: |
||||||||||||||||
| Unrealized gain / (loss) on marketable securities |
(23,033 | ) | 24,817 | 35,054 | (1,784 | ) | ||||||||||
|
|
|
|
|
|
|
|
|
|||||||||
| Total comprehensive loss |
$ | (23,774,203 | ) | $ | (35,009,852 | ) | $ | (10,676,441 | ) | $ | (8,950,075 | ) | ||||
|
|
|
|
|
|
|
|
|
|||||||||
| Net loss per share attributable to common stockholders: |
||||||||||||||||
| Basic and diluted |
$ | (68.28 | ) | $ | (100.52 | ) | $ | (30.74 | ) | $ | (17.64 | ) | ||||
|
|
|
|
|
|
|
|
|
|||||||||
| Shares used to compute net loss per share attributable to common stockholders: |
||||||||||||||||
| Basic and diluted |
347,846 | 348,550 | 348,488 | 507,227 | ||||||||||||
|
|
|
|
|
|
|
|
|
|||||||||
| Pro forma net loss per share attributable to common shareholders (unaudited): |
||||||||||||||||
| Basic and diluted |
$ | (9.86 | ) | $ | (1.21 | ) | ||||||||||
|
|
|
|
|
|||||||||||||
| Weighted average shares used to compute pro forma net loss per share attributable to common stockholders (unaudited): |
||||||||||||||||
| Basic and diluted |
3,544,445 | 7,468,859 | ||||||||||||||
|
|
|
|
|
|||||||||||||
See accompanying notes.
F-4
AMEDICA CORPORATION
Consolidated Statements of Convertible Preferred Stock and Stockholders’ Deficit
| Convertible Preferred Stock |
Common Stock | Additional Paid-In Capital/ (Capital Deficiency) |
Accumulated Other Comprehensive Income (Loss) |
Accumulated Deficit |
Total Stockholders’ Deficit |
|||||||||||||||||||||||||||
| Shares | Amount | Shares | Amount | |||||||||||||||||||||||||||||
| Balance at December 31, 2010 |
57,582,869 | $ | 117,337,084 | 346,617 | $ | 3,475 | $ | (18,487,516 | ) | $ | — | $ | (72,850,925 | ) | $ | (91,334,966 | ) | |||||||||||||||
| Issuance of Series A preferred stock upon exercise of warrants |
48,125 | 31,763 | — | — | — | — | — | — | ||||||||||||||||||||||||
| Issuance of Series A preferred stock upon cashless exercise of warrants |
157,248 | 96,159 | — | — | — | — | — | — | ||||||||||||||||||||||||
| Issuance of Series B preferred stock upon cashless exercise of warrants |
94,647 | 36,188 | — | — | — | — | — | — | ||||||||||||||||||||||||
| Issuance of common stock upon exercise of stock options |
— | — | 667 | 7 | 3,680 | — | — | 3,687 | ||||||||||||||||||||||||
| Stock-based compensation |
— | — | — | — | 826,360 | — | — | 826,360 | ||||||||||||||||||||||||
| Unrealized loss on marketable securities |
— | — | — | — | — | (23,033 | ) | — | (23,033 | ) | ||||||||||||||||||||||
| Net loss |
— | — | — | — | — | — | (23,751,170 | ) | (23,751,170 | ) | ||||||||||||||||||||||
|
|
|
|
|
|
|
|
|
|
|
|
|
|
|
|
|
|||||||||||||||||
| Balance at December 31, 2011 |
57,882,889 | 117,501,194 | 348,284 | 3,482 | (17,657,476 | ) | (23,033 | ) | (96,602,095 | ) | (114,279,122 | ) | ||||||||||||||||||||
| Issuance of Series C preferred stock as US Spine settlement shares |
2,557,562 | 5,115,124 | — | — | — | — | — | — | ||||||||||||||||||||||||
| Issuance of Series E preferred stock as US Spine settlement shares |
842,443 | 1,684,886 | — | — | — | — | — | — | ||||||||||||||||||||||||
| Issuance of Series F preferred stock upon conversion of convertible debt, |
— | — | — | — | — | — | ||||||||||||||||||||||||||
| net of issuance costs |
14,887,500 | 29,173,113 | — | |||||||||||||||||||||||||||||
| Issuance of common stock upon exercise of stock options |
— | — | 450 | 5 | 5,245 | — | — | 5,250 | ||||||||||||||||||||||||
| Stock-based compensation |
— | — | — | — | 1,001,254 | — | — | 1,001,254 | ||||||||||||||||||||||||
| Unrealized loss on marketable securities |
— | — | — | — | — | 24,817 | — | 24,817 | ||||||||||||||||||||||||
| Net loss |
— | — | — | — | — | — | (35,034,669 | ) | (35,034,669 | ) | ||||||||||||||||||||||
|
|
|
|
|
|
|
|
|
|
|
|
|
|
|
|
|
|||||||||||||||||
| Balance at December 31, 2012 |
76,170,394 | 153,474,317 | 348,734 | 3,487 | (16,650,977 | ) | 1,784 | (131,636,764 | ) | (148,282,470 | ) | |||||||||||||||||||||
| Issuance of common stock upon exercise of warrants (unaudited) |
— | — | 178,516 | 1,785 | 2,876,712 | — | — | 2,878,497 | ||||||||||||||||||||||||
| Issuance of common stock upon cashless exercise of stock options (unaudited) |
— | — | 27,624 | 276 | (276 | ) | — | — | — | |||||||||||||||||||||||
| Issuance of common stock upon exercise of stock options (unaudited) |
— | — | 29,680 | 297 | 76,203 | — | — | 76,500 | ||||||||||||||||||||||||
| Issuance of Series F preferred stock for $2.00 per share, net of issuance costs (unaudited) |
4,740,000 | 7,981,495 | — | — | — | — | — | — | ||||||||||||||||||||||||
| Stock-based compensation (unaudited) |
— | — | 13,121 | 132 | 381,314 | — | — | 381,446 | ||||||||||||||||||||||||
| Unrealized loss on marketable securities (unaudited) |
— | — | — | — | — | (1,784 | ) | — | (1,784 | ) | ||||||||||||||||||||||
| Net loss (unaudited) |
— | — | — | — | — | — | (8,948,291 | ) | (8,948,291 | ) | ||||||||||||||||||||||
|
|
|
|
|
|
|
|
|
|
|
|
|
|
|
|
|
|||||||||||||||||
| Balance at September 30, 2013 |
80,910,394 | $ | 161,455,812 | 597,675 | $ | 5,977 | $ | (13,317,024 | ) | $ | — | $ | (140,585,055 | ) | $ | (153,896,102 | ) | |||||||||||||||
|
|
|
|
|
|
|
|
|
|
|
|
|
|
|
|
|
|||||||||||||||||
See accompanying notes.
F-5
AMEDICA CORPORATION
Consolidated Statements of Cash Flows
| Year Ended December 31, | Nine Months Ended September 30, |
|||||||||||||||
| 2011 | 2012 | 2012 | 2013 | |||||||||||||
| (unaudited) | ||||||||||||||||
| Operating activities |
||||||||||||||||
| Net loss |
$ | (23,751,170 | ) | $ | (35,034,669 | ) | $ | (10,711,495 | ) | $ | (8,948,291 | ) | ||||
| Adjustments to reconcile net loss to net cash used in operating activities: |
||||||||||||||||
| Write-down of intangible assets |
— | 15,280,861 | — | — | ||||||||||||
| Change in fair value of contingent consideration |
4,831,609 | — | — | — | ||||||||||||
| Depreciation expense |
3,823,778 | 2,378,655 | 1,843,000 | 1,289,561 | ||||||||||||
| Amortization of intangible assets |
1,884,916 | 1,884,917 | 1,413,688 | 375,440 | ||||||||||||
| Amortization of lease incentive for tenant improvements |
19,752 | 19,752 | 14,814 | 14,814 | ||||||||||||
| Accretion of interest expense on US Spine-related note payable |
290,355 | 142,366 | 142,366 | — | ||||||||||||
| Accretion of interest expense on new bank debt |
— | 4,061 | — | 275,143 | ||||||||||||
| Non-cash interest expense on convertible debt |
1,193,664 | 2,511,895 | 1,333,724 | — | ||||||||||||
| Loss on extinguishment of debt |
— | 250,678 | — | — | ||||||||||||
| Non-cash interest expense on bank debt |
— | 21,610 | — | — | ||||||||||||
| Stock based compensation |
826,360 | 1,001,254 | 824,302 | 381,446 | ||||||||||||
| Change in fair value of preferred stock warrant liability |
(307,890 | ) | 85,228 | 109,804 | (73,149 | ) | ||||||||||
| Change in fair value of common stock warrant liability |
(172,381 | ) | 618,256 | (1,348,000 | ) | 223,525 | ||||||||||
| Loss (gain) on sale of equipment |
(8,691 | ) | 151,148 | — | — | |||||||||||
| Write-down of excess and obsolete inventory |
— | 1,042,909 | — | 777,699 | ||||||||||||
| Bad debt expense (recovery) |
297,144 | (27,551 | ) | 95,841 | 101,828 | |||||||||||
| Payments on acquired US Spine liabilities |
(356,972 | ) | — | — | — | |||||||||||
| Changes in operating assets and liabilities: |
||||||||||||||||
| Trade accounts receivable |
(652,675 | ) | (541,497 | ) | (75,078 | ) | 1,569,857 | |||||||||
| Prepaid expenses and other current assets |
205,507 | (843,816 | ) | 234,497 | (1,573,595 | ) | ||||||||||
| Inventories |
(2,893,836 | ) | 1,528,503 | (250,882 | ) | (1,162,100 | ) | |||||||||
| Other long-term assets |
(35,000 | ) | — | — | 2,794 | |||||||||||
| Accounts payable and accrued liabilities |
(85,764 | ) | (221,286 | ) | (34,314 | ) | 1,278,934 | |||||||||
| Deferred rent |
48,496 | 21,284 | 15,962 | (19,263 | ) | |||||||||||
| Deferred revenue |
(64,959 | ) | (4,720 | ) | — | — | ||||||||||
|
|
|
|
|
|
|
|
|
|||||||||
| Net cash used in operating activities |
(14,907,757 | ) | (9,730,162 | ) | (6,391,771 | ) | (5,485,357 | ) | ||||||||
| Investing activities |
||||||||||||||||
| Purchase of property and equipment |
(1,361,789 | ) | (592,893 | ) | (459,521 | ) | (1,570,027 | ) | ||||||||
| (Increase) decrease in restricted cash |
— | (260,459 | ) | — | (38,034 | ) | ||||||||||
| Purchases of marketable securities |
(15,140,518 | ) | (5,081,666 | ) | — | — | ||||||||||
| Proceeds from maturities of marketable securities |
7,331,874 | 10,209,869 | |
6,274,840 |
|
2,680,441 | ||||||||||
|
|
|
|
|
|
|
|
|
|||||||||
| Net cash provided by (used in) investing activities |
(9,170,433 | ) | 4,274,851 | 5,815,319 | 1,072,380 | |||||||||||
| Financing activities |
||||||||||||||||
| Proceeds from exercise of preferred stock warrants |
31,763 | — | — | — | ||||||||||||
| Proceeds from exercise of common stock warrants |
— | — | — | 2,878,452 | ||||||||||||
| Proceeds from exercise of stock options |
3,687 | 5,250 | 5,251 | 76,545 | ||||||||||||
| Proceeds from line of credit |
2,000,000 | 2,572,929 | 500,000 | 10,939,649 | ||||||||||||
| Payments on line of credit |
(1,860,000 | ) | (2,000,000 | ) | — | (13,512,578 | ) | |||||||||
| Proceeds from issuance of long-term debt |
3,000,000 | 17,888,698 | — | — | ||||||||||||
| Issuance of preferred stock warrants |
— | 111,302 | — | — | ||||||||||||
| Payments on bank debt extinguishment |
— | (15,500,000 | ) | — | — | |||||||||||
| Payments on US Spine debtholder note |
(3,000,000 | ) | (3,000,000 | ) | — | — | ||||||||||
| Proceeds from issuance of convertible debt and common stock warrants, net of issuance costs |
23,574,183 | 4,787,500 | 4,787,500 | — | ||||||||||||
| Proceeds from issuance of convertible preferred stock and warrants for common stock, net of issuance costs |
— | — | — | 8,852,009 | ||||||||||||
|
|
|
|
|
|
|
|
|
|||||||||
| Net cash provided by financing activities |
23,749,633 | 4,865,679 | 5,292,751 | 9,234,077 | ||||||||||||
|
|
|
|
|
|
|
|
|
|||||||||
| Net increase (decrease) in cash and cash equivalents |
(328,557 | ) | (589,632 | ) | 4,716,299 | 4,821,100 | ||||||||||
| Cash and cash equivalents at beginning of period |
3,659,489 | 3,330,932 | 3,330,932 | 2,741,300 | ||||||||||||
|
|
|
|
|
|
|
|
|
|||||||||
| Cash and cash equivalents at end of period |
$ | 3,330,932 | $ | 2,741,300 | $ | 8,047,231 | $ | 7,562,400 | ||||||||
|
|
|
|
|
|
|
|
|
|||||||||
| Supplemental cash flow information |
||||||||||||||||
| Common stock warrants issued in connection with convertible debt |
$ | 2,339,044 | $ | — | $ | — | $ | — | ||||||||
| Cash paid for interest |
$ | 1,928,689 | $ | 3,078,519 | $ | 2,302,851 | $ | 913,571 | ||||||||
See accompanying notes.
F-6
AMEDICA CORPORATION
NOTES TO CONSOLIDATED FINANCIAL STATEMENTS
Years ended December 31, 2011 and 2012 (audited) and Nine Months ended September 30, 2012 and 2013 (unaudited)
1. Organization and Summary of Significant Accounting Policies
Amedica Corporation (“Amedica” or “the Company”) was incorporated in the state of Delaware on December 10, 1996. Amedica is a commercial-stage biomaterial company focused on using its silicon nitride technology platform to develop, manufacture, and commercialize a broad range of medical devices. The Company believes it is the first and only manufacturer to use silicon nitride in medical applications. The Company acquired US Spine, Inc. (“US Spine”), a Delaware spinal products corporation with operations in Florida, on September 20, 2010.
Basis of Presentation and Principles of Consolidation
These consolidated financial statements have been prepared by management in accordance with accounting principles generally accepted in the United States (“U.S. GAAP”), and include all assets and liabilities of the Company and its wholly-owned subsidiary, US Spine. All material intercompany transactions and balances have been eliminated.
Unaudited Pro Forma Stockholders’ Equity and Unaudited Pro Forma Loss Per Share
Prior to the completion of the offering contemplated by this prospectus, we expect all of the convertible preferred stock outstanding to convert into shares of common stock at the then applicable conversion rate. Unaudited pro forma convertible preferred stock, common stock and additional paid-in capital on the accompanying consolidated balance sheets assume only the conversion of convertible preferred stock outstanding at September 30, 2013. The unaudited pro forma basic and diluted loss per share calculations assume the conversion of all outstanding shares of convertible preferred stock into common stock using the as-if converted method, as-if such conversion had occurred at the beginning of the period or the issuance date, if later.
Unaudited Interim Financial Information
The accompanying interim balance sheet as of September 30, 2013, the statements of comprehensive loss and cash flows for the nine months ended September 30, 2012 and 2013, the statement of convertible preferred stock and stockholders’ deficit for the nine months ended September 30, 2013 and the interim footnote disclosures are unaudited. These unaudited interim financial statements have been prepared in accordance with U.S. GAAP. In management’s opinion, the unaudited interim financial statements have been prepared on the same basis as the audited financial statements and include all adjustments, which include only normal recurring adjustments, necessary for the fair presentation of the Company’s financial position as of September 30, 2013 and its results of operations and comprehensive loss and its cash flows for the nine months ended September 30, 2012 and 2013. The results for the nine months ended September 30, 2013 are not necessarily indicative of the results expected for the full fiscal year or any other interim period.
Liquidity and Capital Resources
For the years ended December 31, 2011 and 2012 and the nine months ended September 30, 2012 and 2013, the Company incurred a net loss of $23.8 million, $35.0 million, $10.7 million and $8.9 million, respectively and used cash in operations of $14.9 million, $9.7 million, $6.4 million and $5.5 million, respectively. The Company had an accumulated deficit of $131.6 million as of December 31, 2012 and $140.6 million as of September 30, 2013. With the exception of a small net income for the years ended December 31, 2002 and 1999, the Company has incurred net losses in each year since inception. To date, the Company’s operations have been principally financed from proceeds from the issuance of preferred and common stock, convertible debt and bank debt and, to a lesser extent, cash generated from product sales. It is anticipated that the Company will continue to generate operating losses and use cash in operations through 2014.
F-7
AMEDICA CORPORATION
NOTES TO CONSOLIDATED FINANCIAL STATEMENTS (Continued)
Years ended December 31, 2011 and 2012 (audited) and Nine Months ended September 30, 2012 and 2013 (unaudited)
As discussed further in Note 7, the Company is contractually obligated to repay $18.0 million to a bank beginning in January 2014, over a period of 30 months. In order to finance the continued growth in product sales, to invest in further product development and to otherwise satisfy obligations as they mature, the Company expects to seek additional financing in the near term through the issuance of common and preferred stock and/or convertible debt. As of December 31, 2012 and September 30, 2013, the Company had approximately $5.7 million and $7.9 million, respectively, in cash and investments. Based on business operating plans for 2013 and 2014, including the proceeds from the sale of Series F convertible preferred stock and taking into account the required minimum liquidity financial debt covenant discussed in Note 7, the Company expects its existing cash and investments to support its operations through the completion of this offering. Additional funding may not be available to the Company on acceptable terms, or at all. If the Company is unable to access additional funds when needed, it may not be able to continue the development of its silicon nitride interbody spinal fusion products or the Company could be required to delay, scale back or eliminate some or all of its development programs and other operations. Any additional equity financing, if available to the Company, may not be available on favorable terms, will most likely be dilutive to its current stockholders, and debt financing, if available, may involve more restrictive covenants. The Company’s ability to access capital when needed is not assured and, if not achieved on a timely basis, will materially harm its business, financial condition and results of operations. These uncertainties create substantial doubt about the Company’s ability to continue as a going concern. The Report of Independent Registered Public Accounting Firm at the beginning of these financial statements includes a going concern explanatory paragraph.
The accompanying financial statements have been prepared on a basis which assumes that the Company will continue as a going concern, which contemplates the realization of assets and the satisfaction of liabilities and commitments in the normal course of business. The financial statements do not include any adjustments that may result from the outcome of this uncertainty.
Use of Estimates
The preparation of financial statements in conformity with U.S. GAAP requires management to make estimates and assumptions that affect the reported amounts of assets and liabilities and disclosure of contingent assets and liabilities at the date of the financial statements and the reported amounts of revenue and expenses during the period. Actual results could differ from those estimates. Some of the more significant estimates relate to inventory, stock-based compensation, long-lived and intangible assets, contingent consideration and the liability for preferred stock and common stock warrants.
Concentrations of Credit Risk and Significant Customers
Financial instruments which potentially subject the Company to concentrations of credit risk consist primarily of cash and cash equivalents, marketable securities, accounts receivable and restricted cash. The Company limits its exposure to credit loss by placing its cash and cash equivalents with high credit-quality financial institutions in bank deposits, money market funds, U.S. government securities and other investment grade debt securities that have strong credit ratings. The Company has established guidelines relative to diversification of its cash and marketable securities and their maturities that are intended to secure safety and liquidity. These guidelines are periodically reviewed and modified to take advantage of trends in yields and interest rates and changes in the Company’s operations and financial position. Although the Company may deposit its cash and cash equivalents with multiple financial institutions, its deposits, at times, may exceed federally insured limits.
The Company’s customers are primarily hospitals and surgical centers. At December 31, 2012, no customer receivable balance was 10% or greater of the Company’s total trade accounts receivable. At September 30, 2013, one customer receivable balance was 11% of the Company’s total trade accounts receivable. There was one
F-8
AMEDICA CORPORATION
NOTES TO CONSOLIDATED FINANCIAL STATEMENTS (Continued)
Years ended December 31, 2011 and 2012 (audited) and Nine Months ended September 30, 2012 and 2013 (unaudited)
customer that accounted for 10% or more of the Company’s revenue representing 17% and 14% of revenue for the years ended December 31, 2011 and 2012, and 15% of revenue for the nine months ended September 30, 2013, respectively.
Credit to customers is granted based upon an analysis of the customers’ individual credit worthiness. The Company’s allowance for bad debts as of December 31, 2011 and 2012, and September 30, 2013, was $284,000, $58,000 and $137,000, respectively. For the years ended December 31, 2011 and 2012, and the nine months ended September 30, 2012 and 2013, the Company recorded bad debt expense (recovery) of $297,000, ($28,000), $96,000, and $102,000, respectively.
Revenue Recognition
The Company derives its product revenue primarily from the sale of spinal fusion devices and related products used in the treatment of spine disorders. The Company’s product revenue is generated from sales to two types of customers: (1) surgeons and hospitals and (2) stocking distributors. Most of our products are sold on a consignment basis through a network of independent sales distributors; however, the Company also sells its products to independent stocking distributors. Product revenue is recognized when all four of the following criteria are met: (1) persuasive evidence that an arrangement exists; (2) delivery of the products has occurred; (3) the selling price of the product is fixed or determinable; and (4) collectability is reasonably assured. The Company generates the majority of its revenue from the sale of inventory that is consigned to independent sales distributors that sell the Company’s products to surgeons and hospitals. For these products, the Company recognizes revenue at the time it is notified the product has been used or implanted and a valid purchase order has been received. For all other transactions, the Company recognizes revenue when title and risk of loss transfer to the stocking distributor, and all other revenue recognition criteria have been met. The Company generally recognizes revenue from sales to stocking distributors at the time the product is shipped to the distributor. Stocking distributors, who sell the products to their customers, take title to the products and assume all risks of ownership at time of shipment. The Company’s stocking distributors are obligated to pay within specified terms regardless of when, if ever, they sell the products. The Company’s policy is to classify shipping and handling costs billed to customers as an offset to total shipping expense in the statement of operations, primarily within sales and marketing. In general, the Company’s customers do not have any rights of return or exchange.
Cost of Revenue
The expenses that are included in cost of revenue include all direct product costs and manufacturing costs. Specific provisions for excess or obsolete inventory are also included in cost of revenue. Beginning in January 2013, cost of revenue also includes the 2.3% excise tax on the sale of medical devices in the United States.
Cash, Cash Equivalents, Restricted Cash, and Investments
The Company considers all cash on deposit, money market accounts and highly-liquid debt instruments purchased with original maturities of three months or less to be cash and cash equivalents. Restricted cash consists of cash we receive from payments of our accounts receivables held in a segregated account that must be applied to pay amounts owed under our revolving credit facility with General Electric Capital Corporation. The Company’s investments in marketable debt and equity securities are deemed by management to be available for sale and are reported at fair market value with the net unrealized appreciation or depreciation reported as a component of accumulated other comprehensive loss in stockholders’ deficit. At the time of sale, any realized appreciation or depreciation, calculated by the specific identification method, is recognized in other income and expense.
Inventories
Inventories are stated at the lower of cost or market, with cost for manufactured inventory determined under the standard cost method which approximates first-in first-out (“FIFO”). Manufactured inventory consists of raw
F-9
AMEDICA CORPORATION
NOTES TO CONSOLIDATED FINANCIAL STATEMENTS (Continued)
Years ended December 31, 2011 and 2012 (audited) and Nine Months ended September 30, 2012 and 2013 (unaudited)
material, direct labor and manufacturing overhead cost components. Inventories purchased from third-party manufacturers are stated at the lower of cost or market using the first-in, first-out method. The Company reviews the carrying value of inventory on a periodic basis for excess or obsolete items, and records any write-down as a cost of revenue, as necessary. It is reasonably possible that the Company may be required to make adjustments to the carrying value of inventory in future periods. The Company holds consigned inventory at distributor and other customer locations where revenue recognition criteria have not yet been achieved.
Property and Equipment
Property and equipment, including surgical instruments and leasehold improvements, are stated at cost, less accumulated depreciation and amortization. Property and equipment are depreciated using the straight-line method over the estimated useful lives of the assets, which range from three to five years. Leasehold improvements are amortized over the shorter of their estimated useful lives or the related lease term, generally five years.
In accounting for long-lived assets, the Company makes estimates about the expected useful lives of the assets, the expected residual values of certain of these assets, and the potential for impairment based on the fair value of the assets and the cash flows they generate. The Company periodically evaluates the carrying value of long-lived assets to be held and used when events and circumstances indicate that the carrying amount of an asset may not be recovered. The Company has not recognized any impairment loss for property and equipment for the year ended December 31, 2012, and the nine months ended September 30, 2013.
Long-Lived Assets and Goodwill
Periodically, the Company assesses potential impairment of its long-lived assets, which include property, equipment, and acquired intangible assets. The Company performs an impairment review whenever events or changes in circumstances indicate that the carrying value may not be recoverable. Factors the Company considers important which could trigger an impairment review include, but are not limited to, significant under-performance relative to historical or projected future operating results, significant changes in the manner of its use of acquired assets or its overall business strategy, and significant industry or economic trends. When the Company determines that the carrying value of a long-lived asset may not be recoverable based upon the existence of one or more of the above indicators, the Company determines the recoverability by comparing the carrying amount of the asset to net future undiscounted cash flows that the asset is expected to generate and recognizes an impairment charge equal to the amount by which the carrying amount exceeds the fair market value of the asset. The Company amortizes intangible assets on a straight-line basis over their estimated useful lives.
The Company tests goodwill for impairment annually as of December 31, or whenever events or changes in circumstances indicate that goodwill may be impaired. The Company initially assesses qualitative factors to determine whether the existence of events or circumstances leads to a determination that it is more-likely-than-not that the fair value of a reporting unit is less than its carrying amount. For goodwill impairment testing purposes, we consider the value of our equity, including the value of our convertible preferred stock, in the total carrying value of our single reporting unit. If, after assessing the totality of events or circumstances, the Company determines it is more-likely-than-not that the fair value of a reporting unit is less than its carrying amount, then the Company performs a first step by comparing the book value of net assets to the fair value of the Company’s single reporting unit. If the fair value is determined to be less than the book value, a second step is performed to compute the amount of impairment as the difference between the estimated fair value of goodwill and the carrying value. Based upon this assessment, the Company determined that it was not more-likely-than-not that the fair value of the Company’s single reporting unit was less than its carrying amount and no goodwill impairment was recognized during the years ended December 31, 2011 or 2012 or the nine months ended
F-10
AMEDICA CORPORATION
NOTES TO CONSOLIDATED FINANCIAL STATEMENTS (Continued)
Years ended December 31, 2011 and 2012 (audited) and Nine Months ended September 30, 2012 and 2013 (unaudited)
September 30, 2012 or 2013. As of December 31, 2011 and 2012 and September 30, 2013, the Company had recorded approximately $6.2 million of goodwill related to the Company’s acquisition of US Spine in 2010.
Research and Development
All research and development costs, including those funded by third parties, are expensed as incurred. Research and development costs consist of engineering, product development, test-part manufacturing, testing, developing and validating the manufacturing process, and regulatory related costs. Research and development expenses also include employee compensation, employee and nonemployee stock-based compensation, supplies and materials, consultant services, and travel and facilities expenses related to research activities.
Advertising Costs
Advertising costs are expensed as incurred. The primary component of the Company’s advertising expenses is advertising in trade periodicals. Advertising costs were approximately $392,000 and $1.1 million for the years ended December 31, 2011 and 2012, respectively, and $343,000 and $334,000 for the nine months ended September 30, 2012 and 2013, respectively.
Income Taxes
The Company recognizes a liability or asset for the deferred tax consequences of all temporary differences between the tax basis of assets and liabilities and their reported amounts in the financial statements that will result in taxable or deductible amounts in future years when the reported amounts of the assets and liabilities are recovered or settled. The income tax benefit for the years ended December 31, 2011 and 2012, is $0 and $726,000, respectively. The Company recognizes interest and penalties as a component of the provision for income taxes. The amount of interest and penalties recognized in the years ended December 31, 2011 and 2012 and for the nine months ended September 30, 2012 and 2013 was $0.
Stock-Based Compensation
The Company records stock-based compensation expense related to employee stock-based awards based on the estimated fair value of the awards as determined on the date of grant. The Company utilizes the Black-Scholes-Merton option pricing model to estimate the fair value of employee stock options. The Black-Scholes-Merton model requires the input of highly subjective and complex assumptions, including the estimated fair value of the Company’s common stock on the date of grant, the expected term of the stock option, and the expected volatility of the Company’s common stock over the period equal to the expected term of the grant. The Company estimates forfeitures at the date of grant and revises the estimates, if necessary, in subsequent periods if actual forfeitures differ from those estimates.
The Company accounts for stock options and warrants to purchase shares of stock that are issued to non-employees based on the estimated fair value of such instruments using the Black-Scholes-Merton option pricing model. The measurement of stock-based compensation expense for these instruments is variable and subject to periodic adjustments to the estimated fair value until the awards vest or, in the case of convertible preferred stock warrants, each reporting period until the warrant is exercised. Any resulting change in the estimated fair value is recognized in the Company’s consolidated statements of comprehensive loss during the period in which the related services are rendered.
Deferred offering costs
Deferred offering costs totaled $1.3 million at September 30, 2013. These costs represent legal and accounting costs related to the Company’s efforts to raise capital through the initial public offering, or IPO, of the Company’s common stock. There were no IPO costs incurred prior to May 1, 2013. Future costs related to the Company’s IPO activities will be deferred until the completion of the IPO, at which time they will be reclassified
F-11
AMEDICA CORPORATION
NOTES TO CONSOLIDATED FINANCIAL STATEMENTS (Continued)
Years ended December 31, 2011 and 2012 (audited) and Nine Months ended September 30, 2012 and 2013 (unaudited)
to additional paid-in capital as a reduction of the IPO proceeds. If the Company terminates its plan for an IPO, any costs deferred will be expensed immediately.
Net Loss Per Share
Basic net loss per share is calculated by dividing the net loss by the weighted-average number of common shares outstanding for the period, without consideration for common stock equivalents. Excluded from the weighted-average number of shares outstanding are unvested restricted stock units (“RSUs”) totaling 123,660 shares for the nine months ended September 30, 2013. Diluted net loss per share is calculated by dividing the net loss by the weighted-average number of common share equivalents outstanding for the period determined using the treasury-stock method. Dilutive common stock equivalents are comprised of convertible preferred stock, warrants for the purchase of convertible preferred stock and common stock, stock options and RSUs outstanding under the Company’s equity incentive plans. For all periods presented, there is no difference in the number of shares used to calculate basic and diluted shares outstanding due to the Company’s net loss position.
Potentially dilutive securities not included in the calculation of diluted net loss per share because to do so would be anti-dilutive are as follows (in common stock equivalent shares):
| Year ended December 31, | Nine months ended September 30, |
|||||||||||||||
| 2011 | 2012 | 2012 | 2013 | |||||||||||||
| Convertible preferred stock |
2,766,073 | 3,578,513 | 2,897,986 | 3,906,566 | ||||||||||||
| Convertible debt shares |
480,609 | — | 577,604 | — | ||||||||||||
| Preferred stock warrants |
80,495 | 90,971 | 80,498 | 90,971 | ||||||||||||
| Options for common stock |
299,072 | 287,418 | 299,581 | 94,126 | ||||||||||||
| Common stock warrants |
374,979 | 377,578 | 377,578 | 473,835 | ||||||||||||
| Restricted stock units |
— | — | — | 123,660 | ||||||||||||
|
|
|
|
|
|
|
|
|
|||||||||
| Total |
4,001,228 | 4,334,480 | 4,233,244 | 4,689,158 | ||||||||||||
|
|
|
|
|
|
|
|
|
|||||||||
Shares are based on the terms of securities outstanding as of the date presented. If antidilution provisions are triggered for the Series F convertible preferred stock, additional dilution could occur.
Unaudited Pro Forma Net Loss Per Share
The following table summarizes our unaudited pro forma net loss per share assuming the conversion rate applicable for Series F convertible preferred stock based on the initial offering price of $5.75 per share:
| Year Ended December 31, 2012 |
Nine Months Ended September 30, 2013 |
|||||||
| Numerator |
||||||||
| Net loss |
$ | (35,034,669 | ) | $ | (8,948,291 | ) | ||
| Change in fair value of preferred stock warrant liability |
85,228 | (73,149 | ) | |||||
|
|
|
|
|
|||||
| Pro forma net loss |
$ | (34,949,441 | ) | $ | (9,021,440 | ) | ||
|
|
|
|
|
|||||
| Denominator |
||||||||
| Shares used to compute net loss per common share, basic and diluted |
348,550 | 507,227 | ||||||
| Add: Pro forma adjustments to reflect assumed weighted-average effect of conversion of convertible preferred stock |
3,195,895 | 6,961,632 | ||||||
|
|
|
|
|
|||||
| Shares used to compute pro forma net loss per common share, basic and diluted |
3,544,445 | 7,468,859 | ||||||
|
|
|
|
|
|||||
| Pro forma net loss per common share, basic and diluted (unaudited) |
$ | (9.86 | ) | $ | (1.21 | ) | ||
|
|
|
|
|
|||||
F-12
AMEDICA CORPORATION
NOTES TO CONSOLIDATED FINANCIAL STATEMENTS (Continued)
Years ended December 31, 2011 and 2012 (audited) and Nine Months ended September 30, 2012 and 2013 (unaudited)
Immaterial error correction
Subsequent to the filing of the unaudited interim financial statements as of and for the nine months ended September 30, 2013, the Company determined the change in fair value of common stock warrant liability included in operating cash flows was overstated by approximately $870,000, and the proceeds from issuance of convertible preferred stock in the financing cash flows was understated by approximately $870,000. This error has been corrected by reducing the change in fair value of common stock warrant liability adjustment to operating cash flows by approximately $870,000, and increasing the disclosed proceeds from the issuance of preferred shares by approximately $870,000. This correction of an error was not considered material to the consolidated balance sheet, consolidated statement of convertible preferred stock and stockholders’ deficit of the consolidated statement of cash flows, and had no effect on the Company’s consolidated statements of comprehensive loss as of September 30, 2013 and for the nine months then ended.
Reverse Stock Split
On February 11, 2014, the Company effected a 1 for 25.7746 reverse stock split of the Company’s common stock. The par value and the authorized shares of the common and convertible preferred stock were not adjusted as a result of the reverse stock split. All common stock share and per-share amounts for all periods presented in these financial statements have been adjusted retroactively to reflect the reverse stock split.
2. Intangible Assets
Indefinite lived intangible assets consist of trademarks, while amortizable intangible assets subject to amortization consist of customer relationships, developed technology and other patents and patent applications, all of which were acquired in 2010 in connection with the US Spine acquisition. The amortizable intangible assets are being amortized over a period of 12 years from the acquisition date. As of December 31, 2011 and 2012 and September 30, 2013, the weighted average remaining life was 10.7, 9.7 and 8.9 years, respectively.
Impairment Analysis
Management of the Company noted that certain US Spine product sales, as well as sales to certain acquired US Spine customers during the one-year period ended December 31, 2012 have been less than expected relative to the forecasted revenues at the time of the acquisition. This indicator prompted the Company to question whether the carrying value of its long-lived and indefinite lived intangible assets would be recoverable. Management compared the carrying amount of the assets to net future undiscounted cash flows that the intangible assets are expected to generate, and concluded that an impairment existed. All of the Company’s definite-lived and indefinite-lived intangible assets are categorized within Level 3 of the fair value hierarchy. Management estimated the fair values of the intangible assets and recognized an impairment loss of approximately $15.3 million in the year ended December 31, 2012. Significant assumptions included the following:
| Valuation technique |
Discounted cash flow method | |
| Weighted-average cost of capital |
17% | |
| Weighted-average revenue growth rate |
-58% to 10% | |
| EBITDA margin |
8.99% to 12.44% |
F-13
AMEDICA CORPORATION
NOTES TO CONSOLIDATED FINANCIAL STATEMENTS (Continued)
Years ended December 31, 2011 and 2012 (audited) and Nine Months ended September 30, 2012 and 2013 (unaudited)
The details of the impairment loss recorded in the year ended December 31, 2012 are presented below:
| Asset Group |
Net Carrying Value of Intangible Assets Prior to Impairment |
Impairment of Intangible Assets |
Adjusted
Net Carrying Value After Impairment Charge |
|||||||||
| Indefinite-lived intangible assets |
||||||||||||
| Trademark—US SPINE |
$ | 1,244,000 | $ | (1,044,000 | ) | $ | 200,000 | |||||
| Trademark—PREFERENCE |
700,000 | (550,000 | ) | 150,000 | ||||||||
| Trademark—FACET GUN/BOLT |
205,000 | (205,000 | ) | — | ||||||||
| Trademark—JAVELIN |
100,000 | (100,000 | ) | — | ||||||||
|
|
|
|
|
|
|
|||||||
| Subtotal—indefinite-lived intangible assets |
2,249,000 | (1,899,000 | ) | 350,000 | ||||||||
| Long-lived intangible assets |
||||||||||||
| Customer relationships |
7,869,472 | (5,779,539 | ) | 2,089,933 | ||||||||
| Developed technology |
9,242,139 | (6,787,661 | ) | 2,454,478 | ||||||||
| Other patents and patent applications |
1,109,250 | (814,661 | ) | 294,589 | ||||||||
|
|
|
|
|
|
|
|||||||
| Subtotal—long-lived intangible assets |
18,220,861 | (13,381,861 | ) | 4,839,000 | ||||||||
|
|
|
|
|
|
|
|||||||
| Total asset group |
$ | 20,469,861 | $ | (15,280,861 | ) | $ | 5,189,000 | |||||
|
|
|
|
|
|
|
|||||||
Following this impairment loss, the estimated amortization expense for each of the five years ending in 2017 is approximately $501,000 per year and $2,334,000 thereafter. The total accumulated amortization as of December 31, 2011 and 2012 and September 30, 2013, is approximately $2,513,000, $4,398,000 and $4,774,000, respectively.
3. Fair Value, Marketable Securities, and Contingent Consideration Liability
Fair Value Measurements
The Company has implemented the accounting requirements for financial assets, financial liabilities, non-financial assets and non-financial liabilities reported or disclosed at fair value. ASC 820, Fair Value Measurements, defines fair value, establishes a three level hierarchy for measuring fair value in generally accepted accounting principles, and expands disclosures about fair value measurements. Level 1 inputs are quoted prices (unadjusted) in active markets for identical assets or liabilities that a company has the ability to access at the measurement date. Level 2 inputs are inputs other than quoted prices included within Level 1 that are observable for the asset or liability, either directly or indirectly. Level 3 inputs are unobservable inputs for the asset or liability. This hierarchy requires the Company to use observable market data, when available, and to minimize the use of unobservable inputs when determining fair value. The methods described above may produce a fair value calculation that may not be indicative of net realizable value or reflective of future fair values. Furthermore, while the Company believes its valuation methods are appropriate and consistent with other market participants, the use of different methodologies or assumptions to determine the fair value of certain financial instruments could result in a different fair value measurement at the reporting date. Assets are classified in their entirety based on the lowest level of input that is significant to the fair value measurement.
The Company’s financial instruments are cash and cash equivalents, marketable securities, accounts receivable, accounts payable, accrued liabilities, common and preferred stock warrant liabilities, and notes payable. The recorded values of cash and cash equivalents, accounts receivable, accounts payable, and accrued liabilities approximate their fair values based on their short-term nature. The fair value of marketable securities is primarily estimated based upon quoted market prices in either active or inactive markets. The fair value of the common stock warrant liability and the preferred stock warrant is estimated based upon a Black-Scholes-Merton option pricing model. The recorded value of notes payable approximates the fair value as the interest rate approximates market interest rates.
F-14
AMEDICA CORPORATION
NOTES TO CONSOLIDATED FINANCIAL STATEMENTS (Continued)
Years ended December 31, 2011 and 2012 (audited) and Nine Months ended September 30, 2012 and 2013 (unaudited)
Marketable Securities
Marketable securities at December 31, 2012 are summarized as follows:
| December 31, 2012 | ||||||||||||||||
| Amortized Cost |
Gross Unrealized Gains |
Gross Unrealized Losses |
Estimated Fair Value |
|||||||||||||
| Certificates of deposit |
$ | 1,000,000 | $ | 628 | $ | — | $ | 1,000,628 | ||||||||
| Corporate debt securities |
1,678,658 | 1,614 | (459 | ) | 1,679,813 | |||||||||||
|
|
|
|
|
|
|
|
|
|||||||||
| Total |
$ | 2,678,658 | $ | 2,242 | $ | (459 | ) | $ | 2,680,441 | |||||||
|
|
|
|
|
|
|
|
|
|||||||||
The Company had no marketable securities at September 30, 2013. Marketable securities available for sale in an unrealized loss position as of December 31, 2011 and 2012 are as follows:
| December 31, 2011 | ||||||||||||||||
| Held for less than 12 months | Held for more than 12 months | |||||||||||||||
| Fair Value | Unrealized Losses | Fair Value | Unrealized Losses | |||||||||||||
| Corporate debt securities |
$ | 5,407,385 | $ | (25,244 | ) | $ | 462,272 | $ | (2,514 | ) | ||||||
|
|
|
|
|
|
|
|
|
|||||||||
| Total |
$ | 5,407,385 | $ | (25,244 | ) | $ | 462,272 | $ | (2,514 | ) | ||||||
|
|
|
|
|
|
|
|
|
|||||||||
| December 31, 2012 | ||||||||||||||||
| Held for less than 12 months | Held for more than 12 months | |||||||||||||||
| Fair Value | Unrealized Losses | Fair Value | Unrealized Losses | |||||||||||||
| Corporate debt securities |
$ | 450,000 | $ | (80 | ) | $ | 319,265 | $ | (379 | ) | ||||||
|
|
|
|
|
|
|
|
|
|||||||||
| Total |
$ | 450,000 | $ | (80 | ) | $ | 319,265 | $ | (379 | ) | ||||||
|
|
|
|
|
|
|
|
|
|||||||||
The majority of the Company’s marketable securities are valued using quoted prices in markets that are not active or based on other observable inputs. Commercial paper, certificates of deposit and corporate debt securities are categorized as Level 2 because they are based on evaluated prices that reflect observable market information, such as actual trade information or similar securities, including interest rates and yield curves, adjusted for observable differences. The Company’s asset manager obtains prices from pricing services, whose prices are obtained from direct feeds from market exchanges.
The following table sets forth the fair value of the Company’s financial assets that were re-measured as of December 31, 2011 and 2012, respectively:
| Level 1 | Level 2 | Level 3 | Total | |||||||||||||
| At December 31, 2011: |
||||||||||||||||
| Commercial paper |
$ | — | $ | 649,244 | $ | — | $ | 649,244 | ||||||||
| Corporate debt securities |
— | 7,159,400 | — | 7,159,400 | ||||||||||||
|
|
|
|
|
|
|
|
|
|||||||||
| Total |
$ | — | $ | 7,808,644 | $ | — | $ | 7,808,644 | ||||||||
|
|
|
|
|
|
|
|
|
|||||||||
| Level 1 | Level 2 | Level 3 | Total | |||||||||||||
| At December 31, 2012: |
||||||||||||||||
| Certificate of deposit |
$ | — | $ | 1,000,628 | $ | — | $ | 1,000,628 | ||||||||
| Corporate debt securities |
— | 1,679,813 | — | 1,679,813 | ||||||||||||
|
|
|
|
|
|
|
|
|
|||||||||
| Total |
$ | — | $ | 2,680,441 | $ | — | $ | 2,680,441 | ||||||||
|
|
|
|
|
|
|
|
|
|||||||||
F-15
AMEDICA CORPORATION
NOTES TO CONSOLIDATED FINANCIAL STATEMENTS (Continued)
Years ended December 31, 2011 and 2012 (audited) and Nine Months ended September 30, 2012 and 2013 (unaudited)
The Company had no marketable securities that were required to be remeasured at September 30, 2013.
Maturities of marketable securities are as follows at December 31, 2011 and 2012:
| December 31, 2011 | December 31, 2012 | |||||||||||||||
| Amortized Cost |
Fair Value |
Amortized Cost |
Fair Value |
|||||||||||||
| Due within one year |
$ | 6,426,679 | $ | 6,404,135 | $ | 1,359,013 | $ | 1,360,547 | ||||||||
| Due after one but before five years |
1,404,998 | 1,404,509 | 1,319,645 | 1,319,894 | ||||||||||||
|
|
|
|
|
|
|
|
|
|||||||||
| Total |
$ | 7,831,677 | $ | 7,808,644 | $ | 2,678,658 | $ | 2,680,441 | ||||||||
|
|
|
|
|
|
|
|
|
|||||||||
The Company had no marketable securities at September 30, 2013.
No impairment losses were recognized through earnings related to available for sale securities for the periods ended December 31, 2011 and 2012, and September 30, 2013.
The proceeds from maturities and sales of marketable securities and resulting realized gain and losses for the periods ended December 31, 2011, and 2012 and September 30, 2013 are as follows:
| For the year ended | For the nine months ended September 30, 2013 |
|||||||||||
| December 31, 2011 | December 31, 2012 | |||||||||||
| Proceeds from maturities and sales |
$ | 7,331,874 | $ | 10,209,869 | $ | 2,978,752 | ||||||
| Realized gains |
842 | 127 | 2,158 | |||||||||
| Realized losses |
(268 | ) | — | 115 | ||||||||
For fair value disclosures regarding warrants to purchase convertible preferred stock, see Preferred Stock Warrant Liability under Note 8. For fair value disclosures regarding warrants to purchase common stock, see Common Stock Warrant Liability under Note 7.
Contingent Consideration Liability
The following table presents the Company’s contingent consideration liability, measured at fair value on a recurring basis. The December 31, 2011 fair value was determined based on the ultimate settlement amount which occurred shortly after the end of 2012:
| Contingent Consideration Liability |
||||
| Balance at December 31, 2010 |
$ | 1,968,401 | ||
| Change in fair value included in earnings |
4,831,609 | |||
|
|
|
|||
| Balance at December 31, 2011 |
6,800,010 | |||
| Settlement of contingency by issuance of preferred shares |
(6,800,010 | ) | ||
|
|
|
|||
| Balance at December 31, 2012 |
$ | — | ||
|
|
|
|||
F-16
AMEDICA CORPORATION
NOTES TO CONSOLIDATED FINANCIAL STATEMENTS (Continued)
Years ended December 31, 2011 and 2012 (audited) and Nine Months ended September 30, 2012 and 2013 (unaudited)
4. Property and Equipment
The following is a summary of the components of property and equipment:
| December 31, 2011 |
December 31, 2012 |
September 30, 2013 |
||||||||||
| Manufacturing and lab equipment |
$ | 6,975,210 | $ | 6,975,210 | $ | 7,104,734 | ||||||
| Surgical instruments |
6,910,410 | 6,357,891 | 7,790,509 | |||||||||
| Leasehold improvements |
1,430,221 | 1,430,221 | 1,430,221 | |||||||||
| Software and computer equipment |
901,416 | 807,456 | 807,456 | |||||||||
| Furniture and equipment |
627,751 | 620,751 | 620,751 | |||||||||
|
|
|
|
|
|
|
|||||||
| $ | 16,845,008 | 16,191,529 | 17,753,671 | |||||||||
| Less: accumulated depreciation and amortization |
(11,865,814 | ) | (13,168,997 | ) | (14,450,674 | ) | ||||||
|
|
|
|
|
|
|
|||||||
| $ | 4,979,194 | $ | 3,022,532 | $ | 3,302,998 | |||||||
|
|
|
|
|
|
|
|||||||
5. Inventories
The following is a summary of the components of inventories:
| December 31, 2011 | December 31, 2012 | September 30, 2013 | ||||||||||
| Raw materials |
$ | 981,745 | $ | 968,688 | $ | 924,054 | ||||||
| Work-in-process |
1,367,897 | 421,542 | 1,754,226 | |||||||||
| Finished goods |
9,047,663 | 7,435,664 | 6,532,016 | |||||||||
|
|
|
|
|
|
|
|||||||
| $ | 11,397,306 | $ | 8,825,894 | $ | 9,210,296 | |||||||
|
|
|
|
|
|
|
|||||||
Current finished goods include consigned inventory in the amounts of approximately $4.8 million and $5.6 million as of December 31, 2011 and 2012, respectively and $5.7 million as of September 30, 2013.
Inventory write-downs for excess or obsolete inventory are recorded as a cost of revenue.
6. Accrued Liabilities
Accrued liabilities consist of the following:
| December 31, 2011 |
December 31, 2012 |
September 30, 2013 |
||||||||||
| Commissions |
$ | 513,825 | $ | 755,918 | $ | 688,283 | ||||||
| Payroll and related expenses |
408,446 | 521,555 | 699,323 | |||||||||
| Royalties |
134,373 | 246,300 | 224,734 | |||||||||
| Interest payable |
72,408 | 71,536 | 108,656 | |||||||||
| Final loan payment fee |
— | — | 154,286 | |||||||||
| Trade shows |
329,559 | — | — | |||||||||
| Legal and patent expenses |
136,768 | — | — | |||||||||
| Other |
277,218 | 4,004 | 56,706 | |||||||||
|
|
|
|
|
|
|
|||||||
| $ | 1,872,597 | $ | 1,599,313 | $ | 1,931,988 | |||||||
|
|
|
|
|
|
|
|||||||
F-17
AMEDICA CORPORATION
NOTES TO CONSOLIDATED FINANCIAL STATEMENTS (Continued)
Years ended December 31, 2011 and 2012 (audited) and Nine Months ended September 30, 2012 and 2013 (unaudited)
7. Debt and Line of Credit
The following table summarizes the maturities of the Company’s debt, at face value, as of December 31, 2012:
| 2013 |
$ | — | ||
| 2014 |
7,200,000 | |||
| 2015 |
7,200,000 | |||
| 2016 |
3,600,000 | |||
|
|
|
|||
| $ | 18,000,000 | |||
|
|
|
Total interest expense for all debt instruments for the years ended December 31, 2011 and 2012 and the nine months ended September 30, 2012 and 2013 was $3.5 million, $5.6 million, $3.9 million and $1.3 million, respectively.
Bank Debt
In February 2009, the Company borrowed $5.0 million from a bank under a promissory note agreement (“Term Loan 1”). The Term Loan agreement required that $1.0 million in principal be repaid annually for five years, along with interest which was due and payable on a monthly basis. The interest rate was 3.5% per annum above the Ninety-Day London Interbank Offered Rate. The Company pledged all of its inventory, accounts receivable and equipment as collateral for the loan. The Company could prepay all or any portion of the promissory note without penalty. In December 2009, the Company amended the agreement to extend the first principal repayment date to February 1, 2010. The amendment also added a minimum liquidity covenant of $5.0 million through January 31, 2010, and not less than $6.0 million thereafter.
In April 2010, the Company further amended the Term Loan 1 agreement, extending the date of the first principal repayment, increasing the principal balance of the term loan note from $5.0 million to $7.5 million and adding a line of credit facility, with a total amount available of $2.5 million. The amendment also modified the interest rate for both the promissory note and the line of credit to 4.25% per annum above the 90-day London Interbank Offered Rate with a floor of 4.5% and increased the principal repayments on the term loan note to $1.5 million annually. The amendment provides for an unused commitment fee of 0.5% per annum on the unused portion of the line of credit, payable quarterly in arrears. The amendment also includes a minimum liquidity covenant of $4.0 million through April 2010 and not less than $6.0 million thereafter. The Company received the proceeds from the additional $2.5 million term loan in April 2010 and borrowed $1.86 million under the line of credit in December 2010. In March 2011, the Company repaid the entire $1.86 million borrowed under the line of credit.
In 2010, the Company paid approximately $45,000 in loan fees and related costs in connection with the amendment, which will be amortized over the five year term of the promissory note. Also in 2010, in connection with the amendment, the Company issued warrants to purchase 50,000 shares of the Company’s Series E convertible preferred stock, to the bank. The warrants became exercisable, after one year, at the purchase price of $2.20 per share and expire after five years. There are certain conditions that would have caused the warrants to become immediately exercisable. The Company has accounted for these warrants under the provisions of ASC 480, Distinguishing Liabilities from Equity. Accordingly, the Company has recorded a liability for the fair value of these warrants in 2010, and is required to record fair value adjustments to the liability at the end of each reporting period.
In September 2010, in connection with the acquisition of US Spine, the Company guaranteed a $5.0 million loan to US Spine, a wholly owned subsidiary of the Company (“Term Loan 2”). Term Loan 2 matures on August 1, 2015, is secured by all of the assets of US Spine and requires interest to be paid on a monthly basis. The agreement states that $1.0 million in principal be repaid annually commencing August 1, 2011 and on each
F-18
AMEDICA CORPORATION
NOTES TO CONSOLIDATED FINANCIAL STATEMENTS (Continued)
Years ended December 31, 2011 and 2012 (audited) and Nine Months ended September 30, 2012 and 2013 (unaudited)
August 1 thereafter with one final payment of all interest and outstanding principal due on August 1, 2015. The interest rate is 4.25% per annum above the Ninety-Day London Interbank Offered Rate with a floor of 4.5%. The Company may prepay all or any portion of Term Loan 2 without penalty. The Company paid approximately $53,000 in loan fees and related costs in connection with the agreement, which will be amortized over the remaining term of the note.
In March 2011, the Company amended its Term Loan 1 and Term Loan 2 agreements. The March 2011, amendment to the Term Loan 1 agreement increase the principal from $7.5 million to $10.5 million, increase the annual payments from $1.5 million to $2.1 million and extended the date of the first principal repayment to April 1, 2012 (and annually thereafter) with a final payment due April 1, 2015. The March 2011 amendment to the Term Loan 2 extends the date of the first principal repayment of $1.0 million to August 1, 2012, with a final payment due August 1, 2015. The March 2011 amendments included a minimum liquidity covenant of not less than $6.0 million, minimum EBITDA, minimum gross profit, minimum loan to value and certain other financial covenants and limitations on dividends, distributions, other indebtedness, sale of assets, etc. The March 2011, amendment also grants the bank a perfected first security interest in all assets of the Company. As of December 31, 2011, the Company was not in compliance with its minimum EBITDA and minimum gross profit covenants, but in May 2012, the Company obtained a waiver from the bank. As of May 31, 2012, the Company was in compliance with all of its debt covenants. As of June 30, 2012, the Company was not in compliance with its debt covenants with respect to the issuance of audited financial statements for the year ended December 31, 2011. In July 2012, the Company obtained a waiver from the bank with respect to this covenant.
As of December 31, 2011, $2.0 million and $15.5 million were classified as current and long-term debt, respectively, regarding total bank debt. As of December 31, 2011, the Company was not in compliance with its minimum EBITDA and minimum gross profit covenants but obtained a waiver from the bank in May 2012.
In May 2012, the Company amended its Term Loan 1 and Term Loan 2 agreements. The amendment did not change the principal balances, which remained at $10.5 million and $5.0 million, respectively; however, the annual principal repayments beginning in 2012 for both loans were waived and the maturity date was modified to be April 1, 2013. In connection with the May 2012 amendments new minimum gross profit and minimum EBITDA targets were established and the Company incurred approximately $50,000 in legal and debt modification fees payable to the bank.
In December 2012, the Company repaid all amounts outstanding under the Term Loan 1 and Term Loan 2 agreements with the bank, as well as all amounts outstanding under the line of credit facility, totaling $18.0 million in principal and approximately $36,000 in accrued interest. The Company wrote off approximately $52,000 of capitalized debt issuance costs related to the term loans and the line of credit facility. The Company paid $107,500 in commissions related to the debt restructuring, of which approximately $70,000 was capitalized as debt issuance costs and the remaining $37,500 was recorded as interest expense in 2012. See New Bank Debt disclosures below.
US Spine-Related Note Payable
In connection with the acquisition of US Spine in September 2010, the Company entered into a subordinated secured promissory note agreement to pay two equal payments of $3.0 million to a US Spine stockholder over a two-year period. In accordance with this note agreement, the Company paid $3.0 million to the US Spine stockholder during 2011 and paid the remaining $3.0 million in 2012. The Company discounted the note using an imputed interest rate of 6.5%, which approximated a market rate of interest on the acquisition date. As of December 31, 2011, $2.9 million was classified as a current liability.
F-19
AMEDICA CORPORATION
NOTES TO CONSOLIDATED FINANCIAL STATEMENTS (Continued)
Years ended December 31, 2011 and 2012 (audited) and Nine Months ended September 30, 2012 and 2013 (unaudited)
Senior Secured Subordinated Convertible Promissory Notes
From March to May 2011, the Company issued $24.8 million in aggregate principal amount of Senior Secured Subordinated Convertible Promissory Notes (the “Notes”). The Company also received a commitment to purchase $5.0 million of Notes in February 2012, at the option of the Company (“Commitment Notes”). The Notes mature two years from issuance (one year on the Commitment Notes) and interest was paid quarterly at 6% for the first year and 8% for year two. The Notes may be converted to common stock at a conversion rate of $51.55 per share. The Note holders also received 3-year warrants exercisable for shares of the Company’s common stock equal to 50% of the principal amount of the Notes divided by two, with an exercise price of $51.55 per share (total of 288,685 warrants) (the “Note Holder Warrants”). The warrants are fully exercisable immediately and expire after three years from issuance. The Company paid approximately $1.2 million in commissions, loan fees and related costs in connection with the Notes, which will be amortized over the two year term of the Notes. In connection with the closing of the Notes, and in accordance with the US Spine acquisition agreement, $1.0 million of the $24.8 million in proceeds was paid in March 2011 towards the $3.0 million due to a US Spine stockholder in September 2011.
As of December 31, 2011, $0 and $23.6 million were classified as current and long-term debt, respectively, regarding the Notes. The long-term amount of $23.6 million as of December 31, 2011 was increased by $5.0 million in February 2012 by the Commitment Notes, and was being accreted up to $29.8 million by the maturity dates in March–May 2013, through charges to interest expense.
In December 2012, contemporaneous with the closing of the New Bank Debt (see below), holders of approximately 82% of the outstanding principal balance of the Notes consented to the conversion of the Notes into shares of Series F convertible preferred stock at $2.00 per share, pursuant to the Company’s request. The Company issued 14,887,500 shares of Series F convertible preferred stock. See Convertible preferred stock under Note 8.
New Bank Debt/Preferred Stock Warrant Liability
In December 2012, the Company closed on a $21.5 million senior secured credit facility (the “New Bank Debt”) with a bank consortium consisting of two lenders, one of which was the existing bank lender from whom the Company borrowed beginning in 2009 (see Bank Debt above). The new agreement consists of a term loan for $18.0 million and a $3.5 million revolving line of credit secured by the Company’s accounts receivable, based on certain defined criteria. The term loan consists of interest only payments for a period of 12 months after which monthly principal payments of approximately $600,000 are required for a period of 30 months. The term loan bears interest at the fixed rate of 7.5% per annum, while the line of credit had an interest rate of 7.0% at December 31, 2012 and September 30, 2013, which is based on the variable rate of 5.5% plus the higher of (i) 1.5% and (ii) the three-month LIBOR determined as of two London business days divided by a number equal to 1.0 minus the aggregate of the rates of reserve requirements on the day that is two London business days prior to the beginning of the interest period for Eurocurrency funding that are required to be maintained by a member bank of the Federal Reserve System. The Company pledged all of its assets as collateral for the loan. The agreement includes a non-refundable final payment fee equal to 4% of the original principal amount of the term loan, as well as an annual management fee equal to $15,000 per year.
The agreement includes certain financial covenants related to minimum liquidity including six (6) times the monthly cash burn amount, as defined, days sales outstanding of accounts receivable balances, and other financial reporting requirements. Upon any event of default, including the financial covenants, the lender may declare the loan immediately due and payable. The agreement provides for an unused credit facility fee of 0.75% per annum of the unused portion of the line of credit, payable monthly in arrears. The Company paid a
total of approximately $333,000 in fees and commissions associated with the New Bank Debt, of which
F-20
AMEDICA CORPORATION
NOTES TO CONSOLIDATED FINANCIAL STATEMENTS (Continued)
Years ended December 31, 2011 and 2012 (audited) and Nine Months ended September 30, 2012 and 2013 (unaudited)
approximately $264,000 was capitalized as debt issuance costs and the remaining $69,000 was recorded as interest expense in 2012. The agreement includes a final payment fee of $720,000 due upon prepayment in full or at scheduled maturity.
In December 2012, in connection with the New Bank Debt, the Company issued warrants to purchase 270,000 shares of the Company’s Series F convertible preferred stock to the two lenders. The warrants are immediately exercisable at the purchase price of $2.00 per share and expire after ten years. The Company has accounted for these warrants under the provisions of ASC 480, Distinguishing Liabilities from Equity. Accordingly, the Company has recorded a liability for the fair value of these warrants in 2012, and is required to record fair value adjustments to the liability at the end of each reporting period. See Preferred Stock Warrant Liability under Note 8.
Pursuant to its terms, the Company must repay its $18.0 million term loan over a period of 30 months, which began in January 2014. As of September 30, 2013, the total outstanding principal and accrued interest was $18.0 million, although the financial statements reflect a carrying value of $17.9 million due to the bifurcated value of warrants issued in connection with the debt. The Company has been in covenant default under the agreement in the past, and was in default with respect to the minimum liquidity covenant in November 2013, and has therefore classified the entire obligation as a current liability.
Common Stock Warrant Liability
Due to the issuance of 288,685 Note Holder Warrants in 2011, the Company was required to allocate the total proceeds received in the Notes offering to the common stock warrants and the Notes using the residual method. Under this method, the fair value of the Note Holder Warrants at the grant date was allocated to the Note Holder Warrants with the remaining proceeds allocated to the Note. The Note Holder Warrants are considered mark-to-market liabilities which are re-measured to fair value at each reporting period due to a round down provision whereby the exercise price of the warrants would change, if subsequent equity instruments were issued with an exercise price less than $51.55 per share. The fair value of the Note Holder Warrants at the grant date was approximately $1.8 million based upon the Black-Scholes-Merton option pricing model and the assumptions set forth in the table below. This amount has been recorded as a derivative liability while also reducing the carrying amount of the Notes. During the year ended December 31, 2011, approximately $559,000 was accreted as non-cash interest expense and increased the carrying amount of the Notes. The Company revalued the fair value of the derivative liability as of December 31, 2011, using the Black-Scholes-Merton option pricing model and decreased the carrying amount of the derivative liability by approximately $192,000.
In connection with the issuance of the Notes, the Company issued warrants to purchase 57,557 shares of common stock to the placement agent in May 2011, in connection with the Notes, the Company was required to record the fair value of the warrants of approximately $535,000 as a derivative liability, similar to the $1.8 million associated with the issuance of Note Holder Warrants with the offset being capitalized as debt issuance costs included in prepaid expenses. This asset was written off in 2012 to interest expense in connection with the conversion of the associated debt to equity; see Senior Secured Subordinated Convertible Promissory Note above. The warrants are fully exercisable after one year from issuance and expire after five years from issuance. The exercise price of the warrants is equal to 110% of the conversion price of the underlying common stock, or $56.70. On the closing of the initial public offering, all of the common stock warrants issued to the placement agent will become immediately exercisable. The Company capitalized the initial value of the warrants as debt issuance costs with a corresponding derivative liability for common stock warrants.
The initial value of the placement agent warrants was approximately $535,000 was based upon the Black-Scholes-Merton option pricing model and the 2011 per-share assumptions set forth in the table below. During the year ended December 31, 2011, the Company amortized $166,000 as non-cash interest expense which reduced the carrying value of the debt issuance costs and will continue amortizing the debt issuance costs over the
F-21
AMEDICA CORPORATION
NOTES TO CONSOLIDATED FINANCIAL STATEMENTS (Continued)
Years ended December 31, 2011 and 2012 (audited) and Nine Months ended September 30, 2012 and 2013 (unaudited)
remaining term of the Notes. The Company revalued the derivative liability as of December 31, 2011, using the Black-Scholes-Merton option pricing model and the 2011 assumptions set forth below and increased the carrying amount by approximately $20,000. The change in the fair value of the derivative liability for all of the common stock warrants for the year ended December 31, 2011 was a decrease of approximately $172,000.
The Company will continue to adjust the common stock warrant liability for changes in fair value until the earlier of the exercise of the warrants to purchase shares of common stock or the completion of a liquidation event. The common stock warrant liability fair value was determined using primarily unobservable inputs and has been classified as a Level 3 liability in accordance with U.S. GAAP.
During 2012 the Company reduced the exercise price of the 288,685 Note Holder Warrants, from $51.55 to $25.77 per share, in connection with the conversion of the convertible debt into 14,887,500 shares of Series F convertible preferred stock as discussed above and in Note 8 and also extended the expiration date by four years to March 2018. This caused an increase in the value of the common stock liability of approximately $2.0 million; see the table below. In February 2013, the Company further reduced the exercise price of the 288,685 Note Holder Warrants, from $25.77 to $17.53 per share, and offered a replacement warrant for every Note Holder Warrant exercised at $17.53 per share. The replacement warrants contain the same terms and conditions (including exercise price and term) as before the February 2013 amendment. This caused an increase in the common stock liability of approximately $339,000. As a result of this amendment, the Company raised $3.1 million from the exercise of warrants for common stock and issued 178,516 shares of common stock. In connection with this financing, the Company paid Creation Capital LLC, its financial advisor, approximately $250,000 in commissions pursuant to its 2012 financial advisor consulting agreement. During August and September 2013 the Company issued warrants to purchase a total of 101,262 shares of common stock in connection with the sale of Series F convertible preferred stock. See “Convertible Preferred Stock” under Note 8. These warrants are classified as liabilities which are re-measured to fair value at the conclusion of each reporting period due to a round down provision whereby the exercise price of the warrants would change if subsequent equity investments were issued with a purchase price less than $25.77 per share with respect to 91,951 of the warrants and $56.70 per share with respect to 9,311 of the warrants. The fair value of the warrants at the grant date was approximately $870,000 based upon the Black-Scholes-Merton option pricing model and the assumptions set forth in the table below. This amount has been recorded as a derivative liability while also reducing the carrying amount of convertible preferred stock.
F-22
AMEDICA CORPORATION
NOTES TO CONSOLIDATED FINANCIAL STATEMENTS (Continued)
Years ended December 31, 2011 and 2012 (audited) and Nine Months ended September 30, 2012 and 2013 (unaudited)
The following table summarizes the changes in the common stock warrant liability for the years ended December 31, 2012 and 2011, and the nine months ended September 30, 2013:
| Common Stock Warrant Liability |
||||
| Balance at December 31, 2010 |
$ | — | ||
| Increase in liability due to issuance of warrants to placement agent |
(534,763 | ) | ||
| Increase in liability due to issuance of warrants to noteholders |
(1,802,553 | ) | ||
| Decrease in fair value included in earnings, as other income |
172,381 | |||
|
|
|
|||
| Balance at December 31, 2011 |
(2,164,935 | ) | ||
| Increase in liability due to modification of warrant terms |
(1,998,575 | ) | ||
| Decrease in fair value included in earnings, as other income |
1,380,319 | |||
|
|
|
|||
| Balance at December 31, 2012 |
(2,783,191 | ) | ||
| Increase in liability due to issuance of warrants to placement agent (unaudited) |
(54,730 | ) | ||
| Increase in liability due to issuance of warrants to investors (unaudited) |
(815,785 | ) | ||
| Increase in liability due to modification of warrant terms (unaudited) |
(339,121 | ) | ||
| Decrease in fair value included in earnings, as other income (unaudited) |
115,597 | |||
|
|
|
|||
| Balance at September 30, 2013 (unaudited) |
$ | (3,877,230 | ) | |
|
|
|
|||
The assumptions used in estimating the common stock warrant liability as of December 31, 2011 and 2012 and September 30, 2013 and for the periods then ended, are set forth below:
| As of and for the year ended December 31, |
As of and for the nine months ended September 30, 2013 |
|||||||||||
| 2011 | 2012 | |||||||||||
| Estimated fair value of Company common shares |
$ | 25.77 | $ | 17.53 | $ | 17.53 | ||||||
| Weighted-average risk free interest rate |
1.31 | % | 0.68 | % | 1.27 | % | ||||||
| Weighted-average expected life (in years) |
3.33 | 4.93 | 4.37 | |||||||||
| Expected dividend yield |
0 | % | 0 | % | 0 | % | ||||||
| Weighted average expected volatility |
64 | % | 71 | % | 71 | % | ||||||
The significant assumptions used in determining the estimated fair value of the Company’s common shares are updated on an annual basis and include the following:
| As of and for the year ended December 31, | ||||||||
| Valuation technique |
2011 | 2012 | ||||||
| Hybrid of discounted cash flow method and guideline public company methodology |
Hybrid of discounted cash flow method and guideline public company methodology |
|||||||
| Weighted-average cost of capital (WACC) |
18 | % | 17 | % | ||||
| Revenue growth rate (range) |
159.4% to 5.7 | % | 32.5% to 5.0 | % | ||||
| Compounded average revenue growth rate |
17.5 | % | 17.7 | % | ||||
| EBITDA margin (range) |
(25.0)% to 28.8 | % | (23.8)% to 32.7 | % | ||||
F-23
AMEDICA CORPORATION
NOTES TO CONSOLIDATED FINANCIAL STATEMENTS (Continued)
Years ended December 31, 2011 and 2012 (audited) and Nine Months ended September 30, 2012 and 2013 (unaudited)
The effect of changes to these significant assumptions on the estimated liability for preferred stock warrants are set forth below:
| Fair value of Company common shares |
Warrant liability increases | |
| WACC increases |
Warrant liability decreases | |
| Revenue growth increases |
Warrant liability increases | |
| Average revenue growth increases |
Warrant liability increases | |
| EBITDA margin increases |
Warrant liability increases | |
| Risk free interest increases |
Warrant liability decreases | |
| Expected average life increases |
Warrant liability increases | |
| Expected dividend yield increases |
Warrant liability decreases | |
| Expected volatility increases |
Warrant liability increases |
8. Equity
Common Stock
The Company had reserved shares of common stock for future issuance as follows:
| December 31, | September 30 |
|||||||||||
| 2011 | 2012 | 2013 | ||||||||||
| Convertible preferred stock |
||||||||||||
| Shares outstanding |
2,245,734 | 2,955,250 | 3,139,152 | |||||||||
| Warrants |
||||||||||||
| Series C convertible preferred stock |
46,703 | 46,703 | 46,703 | |||||||||
| Series D convertible preferred stock |
9,827 | 9,827 | 9,827 | |||||||||
| Series E convertible preferred stock |
23,965 | 23,965 | 23,965 | |||||||||
| Series F convertible preferred stock |
— | 10,475 | 10,475 | |||||||||
| Common stock |
374,979 | 377,578 | 473,835 | |||||||||
| Options outstanding |
299,072 | 287,418 | 93,220 | |||||||||
| Restricted stock units |
— | — | 123,660 | |||||||||
| Shares available for grant under equity incentive plans |
147,858 | 160,124 | 168,553 | |||||||||
|
|
|
|
|
|
|
|||||||
| 3,148,138 | 3,871,340 | 4,089,390 | ||||||||||
|
|
|
|
|
|
|
|||||||
Convertible Preferred Stock
In August and September 2013, the Company issued an aggregate of 4,740,000 shares of Series F convertible preferred stock at a purchase price of $2.00 per share, and associated warrants to purchase 91,951 shares of common stock. The warrants have an exercise price of $25.77 per share and expire after five years. In addition, the Company issued warrants to purchase an aggregate of 9,311 shares of common stock to a placement agent, in August and September 2013. These warrants contain an exercise price of $56.70 per share and expire after five years. See “Common Stock Warrant Liability” under Note 7.
In December 2012, the Company issued 14,887,500 shares of Series F convertible preferred stock at $2.00 per share upon conversion of the Notes. The placement agent received commissions of approximately $447,000 in connection with this conversion. See Senior Secured Subordinated Convertible Promissory Notes under Note 7. See also “Conversion Price Protection for Series F Convertible Preferred Stock” below.
F-24
AMEDICA CORPORATION
NOTES TO CONSOLIDATED FINANCIAL STATEMENTS (Continued)
Years ended December 31, 2011 and 2012 (audited) and Nine Months ended September 30, 2012 and 2013 (unaudited)
At December 31, 2011, convertible preferred stock consisted of the following:
| Series |
Designated Shares |
Shares Issued and Outstanding |
Aggregate Liquidation Preference |
|||||||||
| Series A |
5,800,000 | 5,365,398 | $ | 3,219,239 | ||||||||
| Series A-1 |
10,400,000 | 10,390,463 | 6,234,278 | |||||||||
| Series B |
2,300,000 | 1,944,147 | 2,332,976 | |||||||||
| Series B-1 |
3,300,000 | 3,299,141 | 3,958,969 | |||||||||
| Series C |
5,400,000 | 4,125,000 | 8,250,000 | |||||||||
| Series C-1 |
4,325,000 | 4,275,000 | 8,550,000 | |||||||||
| Series D |
8,200,000 | 7,978,800 | 23,936,400 | |||||||||
| Series D-1 |
6,300,000 | 6,145,667 | 18,437,001 | |||||||||
| Series E |
31,150,000 | 14,359,273 | 28,718,546 | |||||||||
| Undesignated |
22,825,000 | — | — | |||||||||
|
|
|
|
|
|
|
|||||||
| Total |
100,000,000 | 57,882,889 | $ | 103,637,409 | ||||||||
|
|
|
|
|
|
|
|||||||
At December 31, 2012, convertible preferred stock consisted of the following:
| Series |
Designated Shares |
Shares Issued and Outstanding |
Aggregate Liquidation Preference |
|||||||||
| Series A |
5,800,000 | 5,365,398 | $ | 3,219,239 | ||||||||
| Series A-1 |
10,400,000 | 10,390,463 | 6,234,278 | |||||||||
| Series B |
2,300,000 | 1,944,147 | 2,332,976 | |||||||||
| Series B-1 |
3,300,000 | 3,299,141 | 3,958,969 | |||||||||
| Series C |
7,900,000 | 6,682,562 | 13,365,124 | |||||||||
| Series C-1 |
4,325,000 | 4,275,000 | 8,550,000 | |||||||||
| Series D |
8,300,000 | 7,978,800 | 23,936,400 | |||||||||
| Series D-1 |
6,300,000 | 6,145,667 | 18,437,001 | |||||||||
| Series E |
16,200,000 | 15,201,716 | 30,403,432 | |||||||||
| Series F |
14,950,000 | 14,887,500 | 29,775,000 | |||||||||
| Undesignated |
20,225,000 | — | — | |||||||||
|
|
|
|
|
|
|
|||||||
| Total |
100,000,000 | 76,170,394 | $ | 140,212,419 | ||||||||
|
|
|
|
|
|
|
|||||||
At September 30, 2013, convertible preferred stock consisted of the following:
| Series |
Designated Shares |
Shares Issued and Outstanding |
Aggregate Liquidation Preference |
|||||||||
| Series A |
5,800,000 | 5,365,398 | $ | 3,219,239 | ||||||||
| Series A-1 |
10,400,000 | 10,390,463 | 6,234,278 | |||||||||
| Series B |
2,300,000 | 1,944,147 | 2,332,976 | |||||||||
| Series B-1 |
3,300,000 | 3,299,141 | 3,958,969 | |||||||||
| Series C |
7,900,000 | 6,682,562 | 13,365,124 | |||||||||
| Series C-1 |
4,325,000 | 4,275,000 | 8,550,000 | |||||||||
| Series D |
8,300,000 | 7,978,800 | 23,936,400 | |||||||||
| Series D-1 |
6,300,000 | 6,145,667 | 18,437,001 | |||||||||
| Series E |
16,200,000 | 15,201,716 | 30,403,432 | |||||||||
| Series F |
20,710,000 | 19,627,500 | 39,255,000 | |||||||||
| Undesignated |
14,465,000 | — | — | |||||||||
|
|
|
|
|
|
|
|||||||
| Total |
100,000,000 | 80,910,394 | $ | 149,692,419 | ||||||||
|
|
|
|
|
|
|
|||||||
F-25
AMEDICA CORPORATION
NOTES TO CONSOLIDATED FINANCIAL STATEMENTS (Continued)
Years ended December 31, 2011 and 2012 (audited) and Nine Months ended September 30, 2012 and 2013 (unaudited)
The rights and preferences of the convertible preferred stock are as follows:
Dividends
Holders of the convertible preferred stock shall be entitled to receive noncumulative dividends in preference to any dividend on common stock payable only if declared by the Board of Directors. As of December 31, 2011 and 2012, and September 30, 2013, the Board of Directors had not declared any dividends.
Liquidation Preference
In the event of any liquidation or winding up of the Company, including in the event of the merger, consolidation and sale of the Company, the holders of Series F convertible preferred stock shall be entitled to receive, in preference to holders of all other series of preferred stock and holders of common stock, a per share amount equal to $2.00, plus all accrued but unpaid dividends, when, as and if declared. If the Series F convertible preferred stock liquidation preference is paid in full to holders of such preferred stock, thereafter, the holders of Series A and A-1, Series B and B-1, Series C and C-1, Series D and D-1 convertible preferred stock, and Series E convertible preferred stock, shall be entitled to receive ratably, and in preference to the holders of common stock, a per share amount equal to $0.60 for Series A and A-1 convertible preferred stock, $1.20 for Series B and B-1 convertible preferred stock, $2.00 for Series C and C-1 convertible preferred stock, $3.00 for Series D and D-1 convertible preferred stock, and $2.00 for Series E convertible preferred stock plus, with respect to each such series of preferred stock, all declared but unpaid dividends. After the payment of the liquidation preference to the holders of the preferred stock, the remaining assets shall be distributed ratably to the holders of the common stock.
A sale, merger, reorganization, liquidation, dissolution or winding up of the Company may, in certain circumstances, be deemed to be a liquidation event and trigger the liquidation preferences associated with the outstanding shares of convertible preferred stock. Because a change in control could occur and not be solely within the control of the Company, all convertible preferred stock has been deemed to be redeemable and classified outside of permanent equity in the accompanying consolidated balance sheets. However, because the timing of any such redemption is uncertain, the Company will not accrete the carrying value of the convertible preferred stock to its liquidation preference value until it becomes probable that redemption will occur.
Conversion
The holders of the convertible preferred stock shall have the right to convert the shares of preferred stock held by such holders, at any time, into shares of common stock. Upon conversion, any declared but unpaid dividends on the preferred stock will be paid in additional shares of common stock.
The convertible preferred stock shall be automatically converted into common stock, at the then applicable conversion ratio, upon the closing of a public offering of shares of common stock at a per share price not less than the then applicable conversion price (as adjusted for stock splits, stock dividends, recapitalizations, etc.).
F-26
AMEDICA CORPORATION
NOTES TO CONSOLIDATED FINANCIAL STATEMENTS (Continued)
Years ended December 31, 2011 and 2012 (audited) and Nine Months ended September 30, 2012 and 2013 (unaudited)
The conversion ratio of each series of convertible preferred stock at September 30, 2013 is as noted below:
| Series |
Conversion Ratio |
|||
| Series A |
0.0388 | |||
| Series A-1 |
0.0582 | |||
| Series B |
0.0414 | |||
| Series B-1 |
0.0591 | |||
| Series C |
0.0435 | |||
| Series C-1 |
0.0631 | |||
| Series D |
0.0505 | |||
| Series D-1 |
0.0653 | |||
| Series E |
0.0441 | |||
| Series F |
0.0388 | |||
Conversion Price Protection for Series F Convertible Preferred Stock
Holders of the Series F convertible preferred stock enjoy certain protections in the event the Company closes its initial underwritten public offering pursuant to an effective registration statement covering the offer and sale to the public of common stock for the account of the Company (an “IPO”) or closes a transaction that constitutes a change in control of the Company (a “Change in Control Transaction”). In the event the Company closes an IPO and the IPO price per share of common stock offered to the public is equal to or greater than $64.44 per share (subject to adjustment), the Series F conversion price shall be the Series F conversion price in effect immediately prior to the closing of the IPO. In the event the Company closes an IPO and the IPO price per share of common stock offered to the public is less than $64.44 per share (subject to adjustment), the Series F conversion price shall be adjusted to the lesser of (1) 80% of the IPO price per share and (2) the Series F conversion price in effect immediately prior to the IPO. In the event the Company closes a Change in Control Transaction and the aggregate consideration paid, payable, escrowed (including contingent consideration) per common equivalent share is equal to or greater than $64.44 per share (subject to adjustment), the Series F conversion price shall be the Series F conversion price in effect immediately prior to the closing of the Change in Control Transaction. In the event the Company closes a Change in Control Transaction and the transaction consideration per common equivalent share is less than $64.44 per share (subject to adjustment), the Series F conversion price shall be adjusted to the lesser of (1) 80% of the Change in Control consideration per common equivalent share and (2) the Series F conversion price in effect immediately prior to the closing of a Change in Control Transaction.
Voting Rights
The preferred stock will vote together with the common stock, and not as separate classes, except as specifically provided below or as otherwise required by law. Each share of preferred stock shall have a number of votes equal to the number of shares of common stock the preferred stock is convertible into on an as-converted basis.
Unless an affirmative vote of 50% of the combined outstanding shares of preferred stock, voting separately as a class, is obtained, the Company shall not undertake any of the following: (i) declaration or payment of any dividend or other distribution or payment on the (or the redemption, purchase or other acquisition for value of any) capital stock of the Company or any subsidiary; (ii) any liquidation, dissolution, recapitalization or reorganization of the Company; (iii) transfer or disposition of assets or rights with a value of more than $1,000,000; and/or (iv) any amendment to the Company’s certificate of incorporation that changes or alters any of the preferences, voting powers or other rights and privileges of preferred stock.
F-27
AMEDICA CORPORATION
NOTES TO CONSOLIDATED FINANCIAL STATEMENTS (Continued)
Years ended December 31, 2011 and 2012 (audited) and Nine Months ended September 30, 2012 and 2013 (unaudited)
Registration Rights
The preferred stockholders and warrant holders were granted registration rights that provide these holders the right to request, beginning 180 days after the completion of a qualifying initial public offering, that the Company file a registration statement to register under the Securities Act the common stock that would be issued upon conversion of the preferred shares or exercise of the warrants. Thereupon, the Company is obligated to use commercially reasonable efforts to timely file a registration statement. These registration rights are subject to certain conditions and limitations, including the Company’s right, based on advice of the lead managing underwriter of a future offering, to limit the number of shares included in any such registration under certain circumstances.
Preferred Stock Warrant Liability
In connection with the various convertible preferred stock offerings, the placement agent received warrants to purchase convertible preferred stock. The warrants are fully exercisable after one year from issuance and expire after seven years. As described in Note 11, Related-Party Transactions, during 2012 the Company extended the expiration date for the warrants to purchase Series C convertible preferred stock by an additional five years. The exercise price of these warrants is equal to 110% of the offering price of the underlying convertible preferred stock. On the closing of the initial public offering, these warrants will convert into warrants to purchase shares of common stock at the then applicable conversion rate for the related preferred stock. During 2012, the Company granted warrants to purchase Series F convertible preferred stock at $2.00 per share to a bank in connection with the debt refinancing (see Note 7, New Bank Debt). The warrants to purchase Series F convertible preferred stock are immediately exercisable and expire after ten years. The grant dates, number of warrants, exercise price and estimated fair value of the warrants at December 31, 2011 and 2012 and September 30, 2013, are as noted below:
| Estimated Fair Value | ||||||||||||||||
| Series of convertible preferred stock underlying warrants |
Grant Date | Number of Warrants |
Exercise Price | December 31, 2011 |
||||||||||||
| Series C |
02/24/06 | 1,203,750 | $ | 2.20 | $ | 60,188 | ||||||||||
| Series D |
04/27/07 | 253,290 | $ | 3.30 | 27,862 | |||||||||||
| Series E |
03/22/10 | 617,691 | $ | 2.20 | 240,899 | |||||||||||
|
|
|
|
|
|||||||||||||
| 2,074,731 | $ | 328,949 | ||||||||||||||
|
|
|
|
|
|||||||||||||
| Estimated Fair Value | ||||||||||||||||
| Series of convertible preferred stock underlying warrants |
Grant Date | Number of Warrants |
Exercise Price | December 31, 2012 |
||||||||||||
| Series C |
02/24/06 | 1,203,750 | $ | 2.20 | $ | 276,863 | ||||||||||
| Series D |
04/27/07 | 253,290 | $ | 3.30 | 7,599 | |||||||||||
| Series E |
03/22/10 | 617,691 | $ | 2.20 | 129,715 | |||||||||||
| Series F |
12/17/12 | 270,000 | $ | 2.00 | 111,302 | |||||||||||
|
|
|
|
|
|||||||||||||
| 2,344,731 | $ | 525,479 | ||||||||||||||
|
|
|
|
|
|||||||||||||
| Estimated Fair Value | ||||||||||||||||
| Series of convertible preferred stock underlying warrants |
Grant Date | Number of Warrants |
Exercise Price | September 30, 2013 |
||||||||||||
| Series C |
02/24/06 | 1,203,750 | $ | 2.20 | $ | 233,440 | ||||||||||
| Series D |
04/27/07 | 253,290 | $ | 3.30 | 3,971 | |||||||||||
| Series E |
03/22/10 | 617,691 | $ | 2.20 | 106,527 | |||||||||||
| Series F |
12/17/12 | 270,000 | $ | 2.00 | 108,393 | |||||||||||
|
|
|
|
|
|||||||||||||
| 2,344,731 | $ | 452,331 | ||||||||||||||
|
|
|
|
|
|||||||||||||
F-28
AMEDICA CORPORATION
NOTES TO CONSOLIDATED FINANCIAL STATEMENTS (Continued)
Years ended December 31, 2011 and 2012 (audited) and Nine Months ended September 30, 2012 and 2013 (unaudited)
Freestanding warrants for shares that are either putable or warrants for shares that are redeemable are classified as liabilities on the balance sheet at fair value. In connection with the grant of the warrants to purchase Series C convertible preferred stock in 2006, Series D convertible preferred stock in 2007, Series E convertible preferred stock in 2010, and Series F convertible preferred stock in 2012, the Company recorded the initial fair values of the warrants of approximately $929,000, $442,000, $266,000, and $111,000, respectively, as a preferred stock warrant liability. At the end of each reporting period, changes in fair value during the period are recorded as a component of other income or expense. The preferred stock warrant liability fair value was determined using primarily unobservable inputs and has been classified as a Level 3 liability.
During 2011 the Company recorded a $132,000 decrease in the preferred stock warrant liability due to the exercise by stockholders of 282,820 warrants for Series A convertible preferred stock (48,125 for cash and 234,695 net exercised) and 278,374 warrants for Series B convertible preferred stock (all net exercise). For the years ended December 31, 2011 and 2012 and the nine months ended September 30, 2013, the Company recorded a benefit of $308,000, a charge of $85,000 and a benefit of $73,000, respectively, for the change in fair value of the preferred stock warrants. The Company will continue to adjust the liability for changes in fair value until the earlier of the exercise of the warrants to purchase shares of convertible preferred stock, the completion of a liquidation event, including the completion of the initial public offering, at which time the liabilities will be reclassified to stockholders’ deficit when the warrants are converted to common stock warrants, or the expiration of the warrants.
The valuation of the preferred stock warrant liability has been determined using the underlying common share value; See Common Stock Warrant Liability under Note 7. The following table presents the changes in the estimated fair value of the preferred stock warrant liability for the years ended December 31, 2011 and 2012 and the nine months ended September 30, 2013:
| Preferred Stock Warrant Liability |
||||
| Balance at December 31, 2010 |
$ | (769,186 | ) | |
| Cashless exercise of preferred stock warrants |
115,984 | |||
| Reduction in liability due to exercise of warrants for cash |
16,363 | |||
| Change in fair value included in earnings |
307,890 | |||
|
|
|
|||
| Balance at December 31, 2011 |
(328,949 | ) | ||
| Increase in liability due to issuance of warrants |
(111,302 | ) | ||
| Change in fair value included in earnings |
(85,228 | ) | ||
|
|
|
|||
| Balance at December 31, 2012 |
(525,479 | ) | ||
| Change in fair value included in earnings |
73,148 | |||
|
|
|
|||
| Balance at September 30, 2013 (unaudited) |
$ | (452,331 | ) | |
|
|
|
|||
The assumptions used in estimating the preferred stock warrant liability as of December 31, 2011 and 2012 and September 30, 2013 and for the periods then ended, are set forth below:
| As of and for the year ended December 31, |
As of and for the nine months ended September 30, 2013 |
|||||||||||
| 2011 | 2012 | |||||||||||
| Estimated fair value of the Company’s common shares |
$ | 25.77 | $ | 17.53 | $ | 17.53 | ||||||
| Weighted-average risk free interest rate |
1.31 | % | 0.68 | % | 1.09 | % | ||||||
| Weighted-average expected life (in years) |
3.33 | 4.93 | 4.43 | |||||||||
| Expected dividend yield |
0 | % | 0 | % | 0 | % | ||||||
| Weighted-average expected volatility |
64 | % | 71 | % | 76 | % | ||||||
F-29
AMEDICA CORPORATION
NOTES TO CONSOLIDATED FINANCIAL STATEMENTS (Continued)
Years ended December 31, 2011 and 2012 (audited) and Nine Months ended September 30, 2012 and 2013 (unaudited)
The significant assumptions used in determining the estimated fair value of the Company’s common shares are updated on an annual basis and include the following:
| As of and for the year ended December 31, | ||||||||
| Valuation technique |
2011 | 2012 | ||||||
| Hybrid of discounted cash flow method and guideline public company methodology |
Hybrid of discounted cash flow method and guideline public company methodology |
|||||||
| Weighted-average cost of capital (WACC) |
18 | % | 17 | % | ||||
| Revenue growth rate (range) |
159.4% to 5.7 | % | 32.5% to 5.0 | % | ||||
| Compounded average revenue growth rate |
17.5 | % | 17.7 | % | ||||
| EBITDA margin (range) |
(25.0)% to 28.8 | % | (23.8)% to 32.7 | % | ||||
The effect of changes to these significant assumptions on the estimated liability for preferred stock warrants are set forth below:
| Fair value of Company common shares |
Warrant liability increases | |
| WACC increases |
Warrant liability decreases | |
| Revenue growth increases |
Warrant liability increases | |
| Average revenue growth increases |
Warrant liability increases | |
| EBITDA margin increases |
Warrant liability increases | |
| Risk free interest increases |
Warrant liability decreases | |
| Expected average life increases |
Warrant liability increases | |
| Expected dividend yield increases |
Warrant liability decreases | |
| Expected volatility increases |
Warrant liability increases |
2003 and 2012 Option and Equity Plans
Under the Company’s 2003 Stock Option Plan (the “2003 Plan”), the Company’s Board of Directors has authorized the grant of options to employees and nonemployees for the issuance of up to 465,575 shares of the Company’s common stock. All options granted have a term of ten years from the date of the grant and generally become fully exercisable within four years of continued employment or service at a rate defined in each option agreement.
In September 2012, the Company’s Board of Directors adopted the 2012 Employee, Director and Consultant Equity Incentive Plan (the “2012 Plan”) and resolved to cease awarding any further equity awards under the 2003 Plan. At that time there were approximately 155,192 approved and available shares of Common Stock available for issuance under the 2003 Plan. The Board resolved to transfer the available approximately 155,192 shares under the 2003 Plan into the 2012 Plan and further resolved that any outstanding shares of Common Stock represented by awards previously granted under the 2003 Plan that are forfeited, expire or are cancelled without delivery of shares of Common Stock shall be made available for award under the 2012 Plan.
F-30
AMEDICA CORPORATION
NOTES TO CONSOLIDATED FINANCIAL STATEMENTS (Continued)
Years ended December 31, 2011 and 2012 (audited) and Nine Months ended September 30, 2012 and 2013 (unaudited)
A summary of the Company’s stock option activity and related information is as follows:
| # of Options |
Weighted Average Exercise Price |
Restricted Stock |
||||||||||
| December 31, 2010 |
326,894 | $ | 28.35 | — | ||||||||
|
|
|
|
|
|
|
|||||||
| Granted |
48,210 | 25.77 | — | |||||||||
| Exercised |
(667 | ) | 5.41 | — | ||||||||
| Cancelled |
(75,366 | ) | 42.53 | — | ||||||||
|
|
|
|
|
|
|
|||||||
| December 31, 2011 |
299,071 | 27.06 | — | |||||||||
|
|
|
|
|
|
|
|||||||
| Granted |
90,450 | 25.77 | — | |||||||||
| Exercised |
(450 | ) | 11.60 | — | ||||||||
| Cancelled |
(101,654 | ) | 34.28 | — | ||||||||
|
|
|
|
|
|
|
|||||||
| December 31, 2012 |
287,417 | 23.20 | — | |||||||||
|
|
|
|
|
|
|
|||||||
| Granted |
— | — | 132,805 | |||||||||
| Exercised |
(60,719 | ) | 2.84 | — | ||||||||
| Cancelled |
(133,478 | ) | 28.09 | (9,145 | ) | |||||||
|
|
|
|
|
|
|
|||||||
| September 30, 2013 |
93,220 | $ | 29.38 | 123,660 | ||||||||
|
|
|
|
|
|
|
|||||||
| Options exercisable |
92,820 | $ | 29.38 | — | ||||||||
|
|
|
|
|
|
|
|||||||
The total number of shares available for grant under the 2012 Plan as of September 30, 2013 was 168,553.
There were options to purchase 231,469, 235,465 and 92,820 shares of common stock that were exercisable at December 31, 2011 and 2012 and September 30, 2013, respectively, at a weighted-average exercise price of $27.32, $22.42 and $39.38, respectively. The aggregate intrinsic value of all outstanding options as of September 30, 2013 was approximately $124,000, based on an estimated fair value of common stock of $17.53 per share.
Information about outstanding stock options is as follows:
| As of December 31, 2012 | As of September 30, 2013 | |||||||||||||||||||||||
| Exercise Price Per Share |
Options Outstanding |
Weighted- Average Remaining Contractual Life (in years) |
Options Exercisable |
Options Outstanding |
Weighted- Average Remaining Contractual Life (in years) |
Options Exercisable |
||||||||||||||||||
| $2.58—$6.44 |
74,686 | 0.71 | 74,686 | 9,311 | 0.68 | 9,311 | ||||||||||||||||||
| $15.46—$25.77 |
159,607 | 7.55 | 107,654 | 58,634 | 5.90 | 58,234 | ||||||||||||||||||
| $41.24—$61.86 |
53,125 | 5.80 | 53,125 | 25,275 | 4.14 | 25,275 | ||||||||||||||||||
|
|
|
|
|
|
|
|
|
|||||||||||||||||
| $2.58—$61.86 |
287,418 | 5.45 | 235,465 | 93,220 | 92,820 | |||||||||||||||||||
|
|
|
|
|
|
|
|
|
|||||||||||||||||
Stock Options
Stock-based compensation expense is measured at grant date, based on the fair value of the award, and is recognized as expense over the remaining requisite service period.
In March 2012, the board of directors of the Company approved the cancellation of stock options held by active employees and board members with exercise prices above $25.77 per share, and the replacement of such options with options for the same number of shares with 100% immediate vesting on the date of grant. This
F-31
AMEDICA CORPORATION
NOTES TO CONSOLIDATED FINANCIAL STATEMENTS (Continued)
Years ended December 31, 2011 and 2012 (audited) and Nine Months ended September 30, 2012 and 2013 (unaudited)
resulted in additional stock-based compensation expense of approximately $413,000, based on 47,100 options originally granted with exercise prices of $32.22, $41.24, $47.68 or $61.86 per share that were cancelled and using updated inputs into the Black-Scholes-Merton valuation model, as follows:
| Inputs Before Modification |
Inputs Following Modification |
|||||||
| Weighted-average risk-free interest rate |
0.50 | % | 1.11 | % | ||||
| Weighted-average expected life (in years) |
2.50 | 5.00 | ||||||
| Expected dividend yield |
0 | % | 0 | % | ||||
| Weighted-average expected volatility |
65 | % | 71 | % | ||||
Total stock-based compensation expense included in the consolidated statements of comprehensive income was allocated as follows:
| Year
Ended December 31, |
Nine Months
Ended September 30, |
|||||||||||||||
| 2011 | 2012 | 2012 | 2013 | |||||||||||||
| Research and development |
$ | 193,189 | $ | 157,871 | $ | 257,633 | $ | 42,915 | ||||||||
| General and administrative |
449,571 | 479,542 | 309,410 | 88,254 | ||||||||||||
| Sales and marketing |
114,104 | 188,547 | 156,694 | 249,305 | ||||||||||||
| Cost of product revenue |
49,884 | 31,385 | 12,286 | 114 | ||||||||||||
| Capitalized into inventory |
— | 143,909 | 88,281 | 858 | ||||||||||||
|
|
|
|
|
|
|
|
|
|||||||||
| Total |
$ | 806,748 | $ | 1,001,254 | $ | 824,304 | $ | 381,446 | ||||||||
|
|
|
|
|
|
|
|
|
|||||||||
During 2011 and 2012, the Company issued options to employees and directors with exercise prices that, at the time of grant, the board of directors determined to approximate the fair value of the Company’s common stock, taking into consideration a number of factors including the issuance price of shares of the Company’s convertible preferred stock, the preferential terms and conditions of the convertible preferred stock, the status of scientific research and development efforts and associated milestones and the likelihood of achieving a liquidity event for the share of the Company’s common stock.
There were no option grants in the nine months ended September 30, 2013. The fair value of each employee option grant was estimated on the date of grant using the Black-Scholes-Merton valuation model with the following assumptions:
| Year ended December 31, |
Nine Months Ended September 30, |
|||||||||||||||
| 2011 | 2012 | 2012 | 2013 | |||||||||||||
| Weighted average risk-free interest rate |
1.32 | 1.14 | 1.14 | * | ||||||||||||
| Weighted-average expected life (in years) |
6.30 | 5.34 | 5.34 | * | ||||||||||||
| Expected dividend yield |
0 | % | 0 | % | 0 | % | * | |||||||||
| Weighted average expected volatility |
70 | % | 72 | % | 72 | % | * | |||||||||
| Weighted-average fair value of options granted |
$ | 16.50 | $ | 14.18 | $ | 14.18 | * | |||||||||
| * | There were no stock option grants in the nine months ended September 30, 2013 |
The Company’s computation of expected volatility for the year ended December 31, 2011 and 2012 and the nine months ended September 30, 2012 is based on an average of the historical volatility of a peer group of similar companies. The Company’s computation of expected term utilizes the simplified method in accordance with U.S. GAAP. The risk-free interest rate for periods within the contractual life of the option is based on the
F-32
AMEDICA CORPORATION
NOTES TO CONSOLIDATED FINANCIAL STATEMENTS (Continued)
Years ended December 31, 2011 and 2012 (audited) and Nine Months ended September 30, 2012 and 2013 (unaudited)
U.S. Treasury yield curve in effect at the time of grant. The Company recognizes stock-based compensation expense for the fair values of these awards on a straight-line basis over the requisite service period of each of these awards.
As of December 31, 2012, the weighted-average remaining contractual term for outstanding stock options and for exercisable stock options was 5.45 years and 4.99 years, respectively. The total intrinsic value of options exercised for the year ended December 31, 2012 was $6,375, based on 450 shares exercised, an estimated value of common stock during 2012 of $25.77 per share, and an average exercise price of $11.60 per share. Cash received from option exercises for the years ended December 31, 2011 and 2012, was $3,687 and $5,250, respectively. The Company recorded no tax benefit related to options exercised during 2011 and 2012.
As of September 30, 2013, the weighted-average remaining contractual term for outstanding stock options and for exercisable stock options was 4.92 years and 4.86 years, respectively. The total intrinsic value of options exercised for the nine months ended September 30, 2013 was $900,000, based on 60,719 shares exercised, an estimated value of common stock during 2013 of $17.53 per share, and an average exercise price of $2.84 per share. Cash received from option exercises for the nine months ended September 30, 2013 was approximately $77,000. The Company recorded no tax benefit related to options exercised in the nine months ended September 30, 2013.
At December 31, 2011 and 2012 and September 30, 2013, total compensation expense related to nonvested options not yet recognized in the financial statements was approximately $1,049,000, $773,000 and $383,000, respectively, and the weighted-average period over which it was expected to be recognized was 3.15 years, 2.82 years and 1.84 years, respectively. The Company recorded no tax benefit related to these options during any periods presented, since the Company currently maintains a full valuation allowance offsetting its deferred tax assets.
Stock Options and Awards Granted to Nonemployees
The Company did not grant any options to consultants or nonemployees for services in the years ended December 31, 2011 and 2012 or the nine months ended September 30, 2013. The exercise price of all previously granted nonemployee stock options ranges from $2.58 to $47.68 per share.
The following table shows the assumptions used to compute the stock-based compensation expense recognized for nonemployee stock options during the year ended December 31, 2011, the last year in which the expense was recognized, using the Black-Scholes-Merton valuation model:
| Weighted-average risk-free interest rate |
1.45 | % | ||
| Weighted-average expected term (remaining contractual life in years) |
6.33 | |||
| Expected dividend yield |
0 | % | ||
| Weighted-average expected volatility |
68.0 | % |
The estimated fair value of options previously granted to consultants that vested during the year ended December 31, 2011, was $19,613 and was charged to research and development expense. There was no such vesting after December 31, 2011.
The Company issued 13,191 shares of common stock to nonemployees for sales and marketing services in the nine months ended September 30, 2013.
Option Exchange Program
In February 2013, employees of the Company elected to exchange 93,968 stock options for an equal number of RSUs pursuant to a one-time tender offer approved by the board of directors. The RSUs vest solely upon either a change in control or upon the expiration of a lock-up period in connection with an underwritten public offering of shares of the Company’s common stock.
F-33
AMEDICA CORPORATION
NOTES TO CONSOLIDATED FINANCIAL STATEMENTS (Continued)
Years ended December 31, 2011 and 2012 (audited) and Nine Months ended September 30, 2012 and 2013 (unaudited)
The incremental fair value on the date of the exchange between the original stock options and the RSUs issued will be recognized when vesting conditions are achieved.
9. Income Taxes
The following is a reconciliation of the expected statutory federal income tax provision to the actual income tax benefit:
| Years Ended December 31, |
||||||||
| 2011 | 2012 | |||||||
| Income tax benefit at federal statutory rate |
(34.0 | )% | (34.0 | )% | ||||
| Income tax benefit at state statutory rate |
(4.3 | )% | (4.3 | )% | ||||
| Research and development credits |
(1.2 | )% | (0.7 | )% | ||||
| Equity related expenses |
11.6 | % | 6.7 | % | ||||
| Change in valuation allowance |
27.9 | % | 30.3 | % | ||||
|
|
|
|
|
|||||
| 0.0 | % | (2.0 | )% | |||||
|
|
|
|
|
|||||
The following table summarizes the Company’s tax benefit.
| Years Ended December 31, |
||||||||
| 2011 | 2012 | |||||||
| Current: |
||||||||
| Total Current |
$ | — | $ | — | ||||
|
|
|
|
|
|||||
| Deferred: |
||||||||
| State |
$ | $ | (80,667 | ) | ||||
| Federal |
— | (645,333 | ) | |||||
|
|
|
|
|
|||||
| Total Benefit |
$ | — | $ | (726,000 | ) | |||
|
|
|
|
|
|||||
Deferred income taxes reflect the net tax effects of temporary differences between the carrying amount of assets and liabilities for financial reporting purposes and the amounts used for income tax purposes.
Significant components of the Company’s deferred tax assets at December 31 are shown below.
| December 31 | ||||||||
| 2011 | 2012 | |||||||
| Deferred tax assets: |
||||||||
| Net operating loss carryforwards |
$ | 33,025,000 | $ | 38,610,000 | ||||
| Depreciation |
106,000 | 90,000 | ||||||
| Research credits |
1,863,000 | 2,113,000 | ||||||
| Other |
3,603,000 | 3,329,000 | ||||||
|
|
|
|
|
|||||
| Total deferred tax assets |
38,597,000 | 44,142,000 | ||||||
| Deferred tax liabilities: |
||||||||
| Amortization of intangible assets |
(7,623,000 | ) | (1,138,000 | ) | ||||
|
|
|
|
|
|||||
| Total deferred tax liabilities |
(7,623,000 | ) | (1,138,000 | ) | ||||
|
|
|
|
|
|||||
| Net deferred tax assets |
30,974,000 | 43,004,000 | ||||||
| Less valuation allowance |
(31,834,000 | ) | (43,138,000 | ) | ||||
|
|
|
|
|
|||||
| Net deferred tax assets after valuation allowance |
$ | (860,000 | ) | $ | (134,000 | ) | ||
|
|
|
|
|
|||||
F-34
AMEDICA CORPORATION
NOTES TO CONSOLIDATED FINANCIAL STATEMENTS (Continued)
Years ended December 31, 2011 and 2012 (audited) and Nine Months ended September 30, 2012 and 2013 (unaudited)
At December 31, 2011 and 2012, the Company had net operating loss carryforwards for federal and state income tax purposes of approximately $85.3 million and $99.1 million, respectively. The federal and state net operating loss carryforwards will expire from 2023 to 2032, unless previously utilized.
The income tax benefit recorded of $726,000 in 2012 relates to the impairment of intangible assets associated with the 2010 US Spine acquisition. In accordance with Section 382 of the Internal Revenue Code, a change in ownership of greater than 50% within a three-year period places an annual limitation on the Company’s ability to utilize its existing net operating loss carryforwards. The Company may be subject to these annual limitations and, therefore, unable to fully utilize the net operating loss carryforwards. Additionally, the Company may be unable to fully utilize all of the net operating loss carryforwards associated with the US Spine acquisition, due to certain annual limitations.
During the years ended December 31, 2011 and 2012, the Company recognized no amounts related to tax interest or penalties. The Company is subject to taxation in the United States and various state jurisdictions. The Company currently has no years under examination by any jurisdiction.
A valuation allowance has been established as realization of such deferred tax assets has not met the more likely-than-not threshold requirement. If the Company’s judgment changes and it is determined that the Company will be able to realize these deferred tax assets, the tax benefits relating to any reversal of the valuation allowance on deferred tax assets will be accounted for as a reduction to income tax expense. The tax valuation allowance increased by approximately $3.9 million and $11.3 million for the years ended December 31, 2011 and 2012, respectively.
10. Commitments and Contingencies
The Company currently leases laboratory, manufacturing and office space and equipment under noncancelable operating leases which provide for rent holidays and escalating payments. Lease incentives, including rent holidays, allowances for tenant improvements and rent escalation provisions, are recorded as deferred rent. Rent under operating leases is recognized on a straight-line basis beginning with lease commencement through the end of the lease term. For each of the years ended December 31, 2011 and 2012, rental expense was approximately $810,000. For the nine month periods ended September 30, 2012 and 2013, rental expense was approximately $610,000 and $608,000, respectively.
The following table summarizes future minimum rental payments required under operating leases that have initial or remaining non-cancelable lease terms in excess of one year as of December 31, 2012:
| 2013 |
$ | 830,528 | ||
| 2014 |
855,036 | |||
| 2015 |
871,857 | |||
| 2016 |
898,062 | |||
| 2017 |
925,276 | |||
| Thereafter |
1,932,194 | |||
|
|
|
|||
| Total |
$ | 6,312,953 | ||
|
|
|
The Company has entered into consulting and development agreements with some of its advisors, including some surgeon advisors. The Company has agreed to pay some of the surgeon advisors a portion of the net profits attributable to the sale of specific spine products for which the surgeon advisors provided the Company with consulting and related services related to the conceptualization, development, testing, clearance, approval and/or related matters involving implant products. The Company is obligated to pay royalties to as many as 14 different surgeon advisors in connection with the sale of certain of its implant products. These agreements generally
F-35
AMEDICA CORPORATION
NOTES TO CONSOLIDATED FINANCIAL STATEMENTS (Continued)
Years ended December 31, 2011 and 2012 (audited) and Nine Months ended September 30, 2012 and 2013 (unaudited)
continue until the later of (a) ten years from the date of the agreements, and (b) the expiration of the patent rights relating to the devices covered by the agreements, when rights have been assigned by the individuals to the Company. The Company paid $656,000 and $852,000 for the years ended December 31, 2011 and 2012, respectively, and $742,000 and $631,000 for the nine months ended September 30, 2012 and 2013, respectively, relating to these agreements. At December 31, 2011 and 2012 and September 30, 2013, the Company had accrued $134,000, $246,000 and $225,000 relating to these agreements. Also relating to these agreements, the Company recorded $7,000, $6,000 and $6,000 at December 31, 2011 and 2012 and September 30, 2013, respectively, as prepaid royalties.
The Company has executed agreements with certain executive officers of the Company which, upon the occurrence of certain events related to a change in control, call for payments to the executives up to three times their annual salary and accelerated vesting of previously granted stock options.
From time to time, the Company is subject to various claims and legal proceedings covering matters that arise in the ordinary course of its business activities. Management believes any liability that may ultimately result from the resolution of these matters will not have a material adverse effect on the Company’s consolidated financial position, operating results, or cash flows.
11. Related-Party Transactions
Gregg R. Honigblum, the Chief Executive Officer of each of Creation Capital, LLC (“Creation Capital”) and Creation Capital Advisors, LLC (“Creation Advisors”), joined the Company’s board of directors in December 2006 and resigned in September 2013. The Company completed offerings of preferred stock and convertible debt through Creation Capital, as its placement agent, and it received strategic financial advisory services from Creation Advisors.
In conjunction with the Notes issued in 2011 (see Note 8) Creation Capital served as the Company’s placement agent, and was paid $1,049,000 and received warrants exercisable for 57,557 shares of common stock at $56.70 per share as commissions. In February 2012, the Company received the final tranche of $5 million in Notes and paid Creation Capital an additional $212,500.
In connection with the conversion of the Notes to shares of Series F convertible preferred stock in December 2012, the Company was obligated to pay Creation Advisors a strategic financial advisory fee of approximately $447,000. Creation Advisors agreed to a payment plan whereby the Company would pay one half of the advisory fee (or approximately $223,500) immediately, and pay the other half in monthly installments over a period of 24 months. Also pursuant to the financial advisor consulting agreement Company entered into with Creation Advisors in June 2012, the Company paid Creation Advisors a strategic financial advisory fee of approximately $107,500 in 2012 related to the new bank financing which closed in December 2012 (see Note 7).
Pursuant to the June 2012 financial advisor consulting agreement with Creation Advisors, the Company agreed to extend the expiration date of all warrants to purchase Series C convertible preferred stock previously issued to Creation Capital from February 2013 to February 2018. In connection with this modification, the Company recorded additional expense of approximately $520,000.
In conjunction with the warrant restructuring and the sale and issuance of other shares of common stock in March 2013, Creation Advisors was paid a strategic financial advisory fee of approximately $250,000 (see Note 7—Common Stock Warrant Liability).
F-36
AMEDICA CORPORATION
NOTES TO CONSOLIDATED FINANCIAL STATEMENTS (Continued)
Years ended December 31, 2011 and 2012 (audited) and Nine Months ended September 30, 2012 and 2013 (unaudited)
12. 401(k) Plan
Effective June 1, 2004, the Company adopted a defined contribution retirement plan under Section 401(k) of the Internal Revenue Code. The plan covers substantially all employees. Eligible employees may contribute amounts to the plan, via payroll withholdings, subject to certain limitations. The plan permits, but does not require, additional matching contributions to the plan by the Company on behalf of the participants in the plan. The Company incurred approximately $199,000 and $151,000 relating to retirement contributions for the years ended December 31, 2011 and 2012, respectively, and approximately $116,000 and $120,000 for the nine months ended September 30, 2012 and 2013, respectively.
13. Subsequent Events (unaudited)
In October 2013, the Company entered into a one-year consulting agreement for financial advisory services with Creation Advisors in which Creation Advisors will receive compensation of up to $180,000 in cash (payable $15,000 per month).
In November 2013 the Company was in default with respect to the minimum liquidity covenant under its agreement with a bank. The Company obtained an amendment to the agreement in December 2013 which stipulated that the liquidity covenant would not be tested through January 31, 2014. The Company obtained an additional amendment to the agreement on January 28, 2014 from the bank that expires on March 1, 2014. This amendment extended the time through which the liquidity covenant would not be tested to February 28, 2014. Except as noted above, the Company is in compliance with all other covenants under the agreement.
On February 11, 2014, the holders of a majority of the outstanding shares of the Company’s Series F convertible preferred stock agreed to waive the conversion adjustment under the Company’s Restated Certificate of Incorporation such that in no event will the denominator used to calculate the conversion ratio be less than $8.00, provided that the Company completes its initial public offering on or before June 30, 2014.
With respect to the audited financial statements as of and for the year ended December 31, 2012 the Company evaluated subsequent events through September 23, 2013.
The Company has evaluated subsequent events with respect to the unaudited financial statements as of September 30, 2013 and for the nine months then ended through February 11, 2014, to ensure that this submission includes appropriate disclosure of events both recognized in these financial statements, and events which occurred subsequently but were not recognized in the financial statements.
F-37
3,500,000 Shares
Common Stock
PROSPECTUS
February 12, 2014
JMP Securities
Needham & Company
Neither we nor any of the underwriters have authorized anyone to provide information different from that contained in this prospectus. When you make a decision about whether to invest in our common stock, you should not rely upon any information other than the information in this prospectus. Neither the delivery of this prospectus nor the sale of our common stock means that information contained in this prospectus is correct after the date of this prospectus. This prospectus is not an offer to sell or solicitation of an offer to buy these shares of common stock in any circumstances under which the offer or solicitation is unlawful.